Sustainability Performance
Sustainability Performance
What gets measured, gets improved. Transparency on the material environmental, social, and governance performance results signals that it is monitoring progress toward sustainability goals and increases confidence in the company’s ability to create sustainable value for all its stakeholders. Furthermore, sharing results creates an opportunity for benchmarking for others to follow, thereby increasing the speed of learning.
Transparency creates accountability, not just for the company but also for its stakeholders. Better transparency in reporting ESG outcomes can restore trust in business by showing that it is taking action on sustainability. It can also mobilize stakeholders to contribute towards progress towards sustainability goals. Addressing sustainability challenges such as climate change requires collaboration between multiple stakeholder groups in a long time-horizon and trust is essential for that collaboration to be impactful and long-lasting.
Recommendations
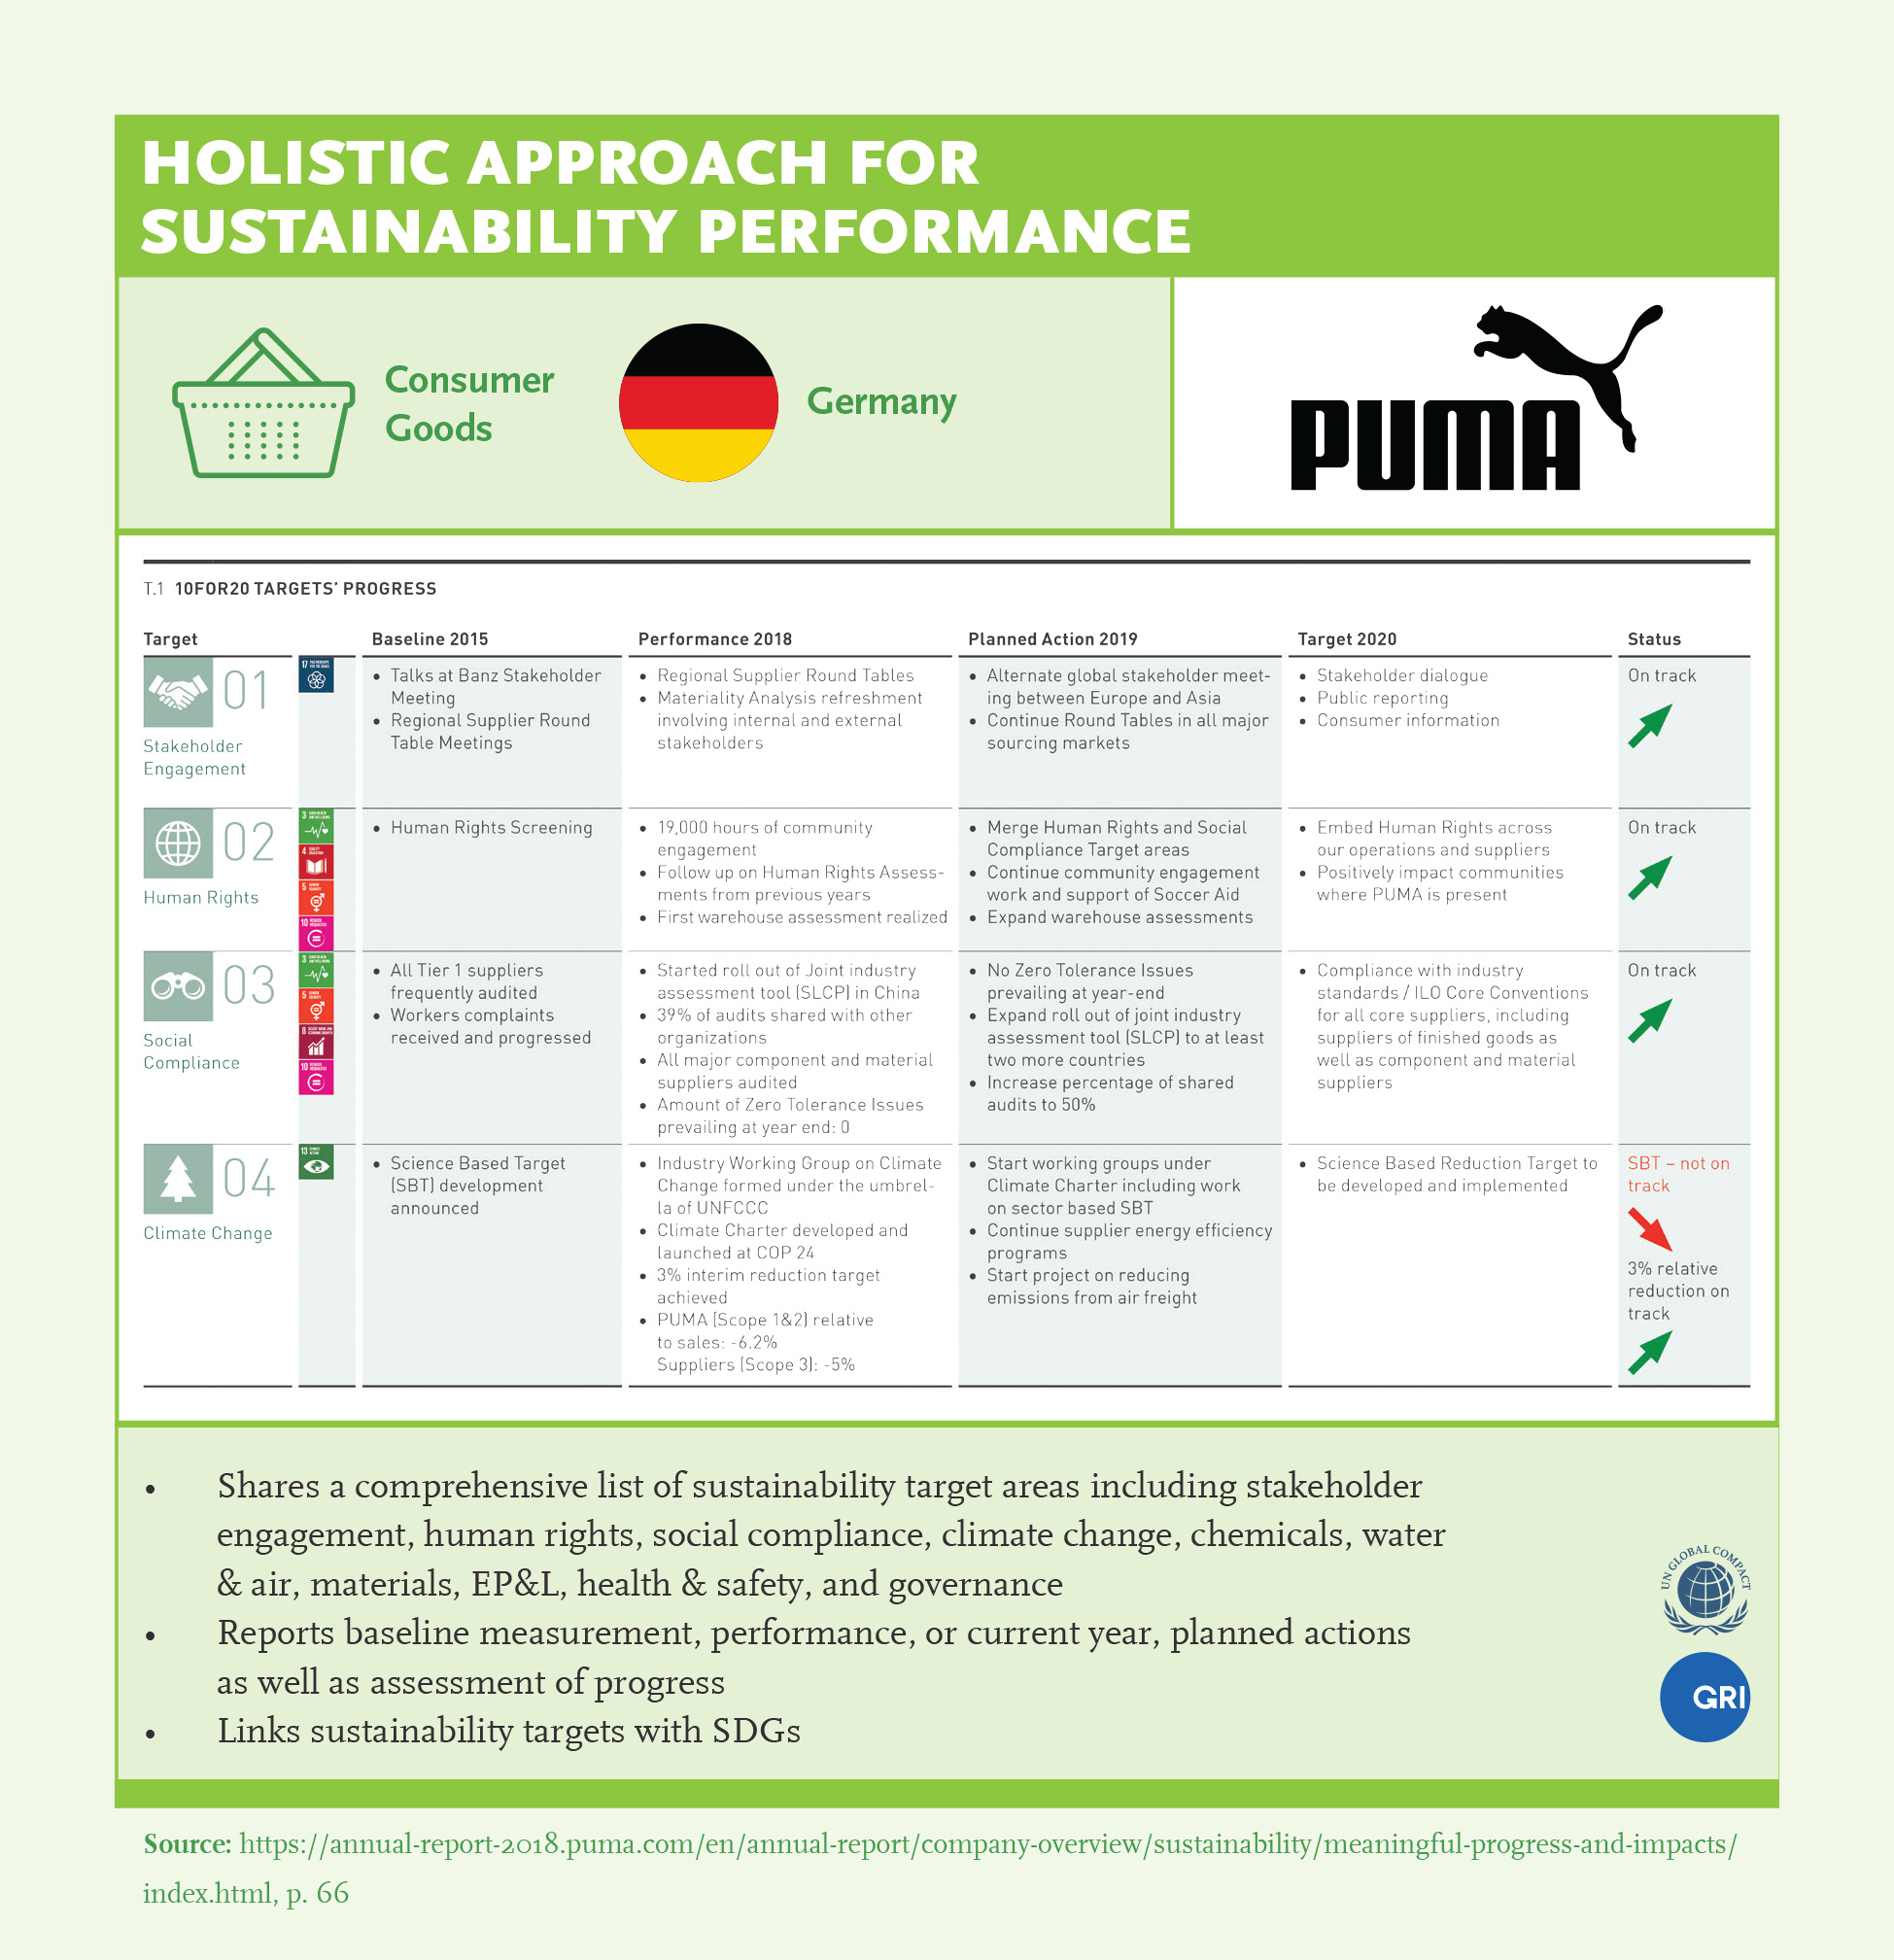
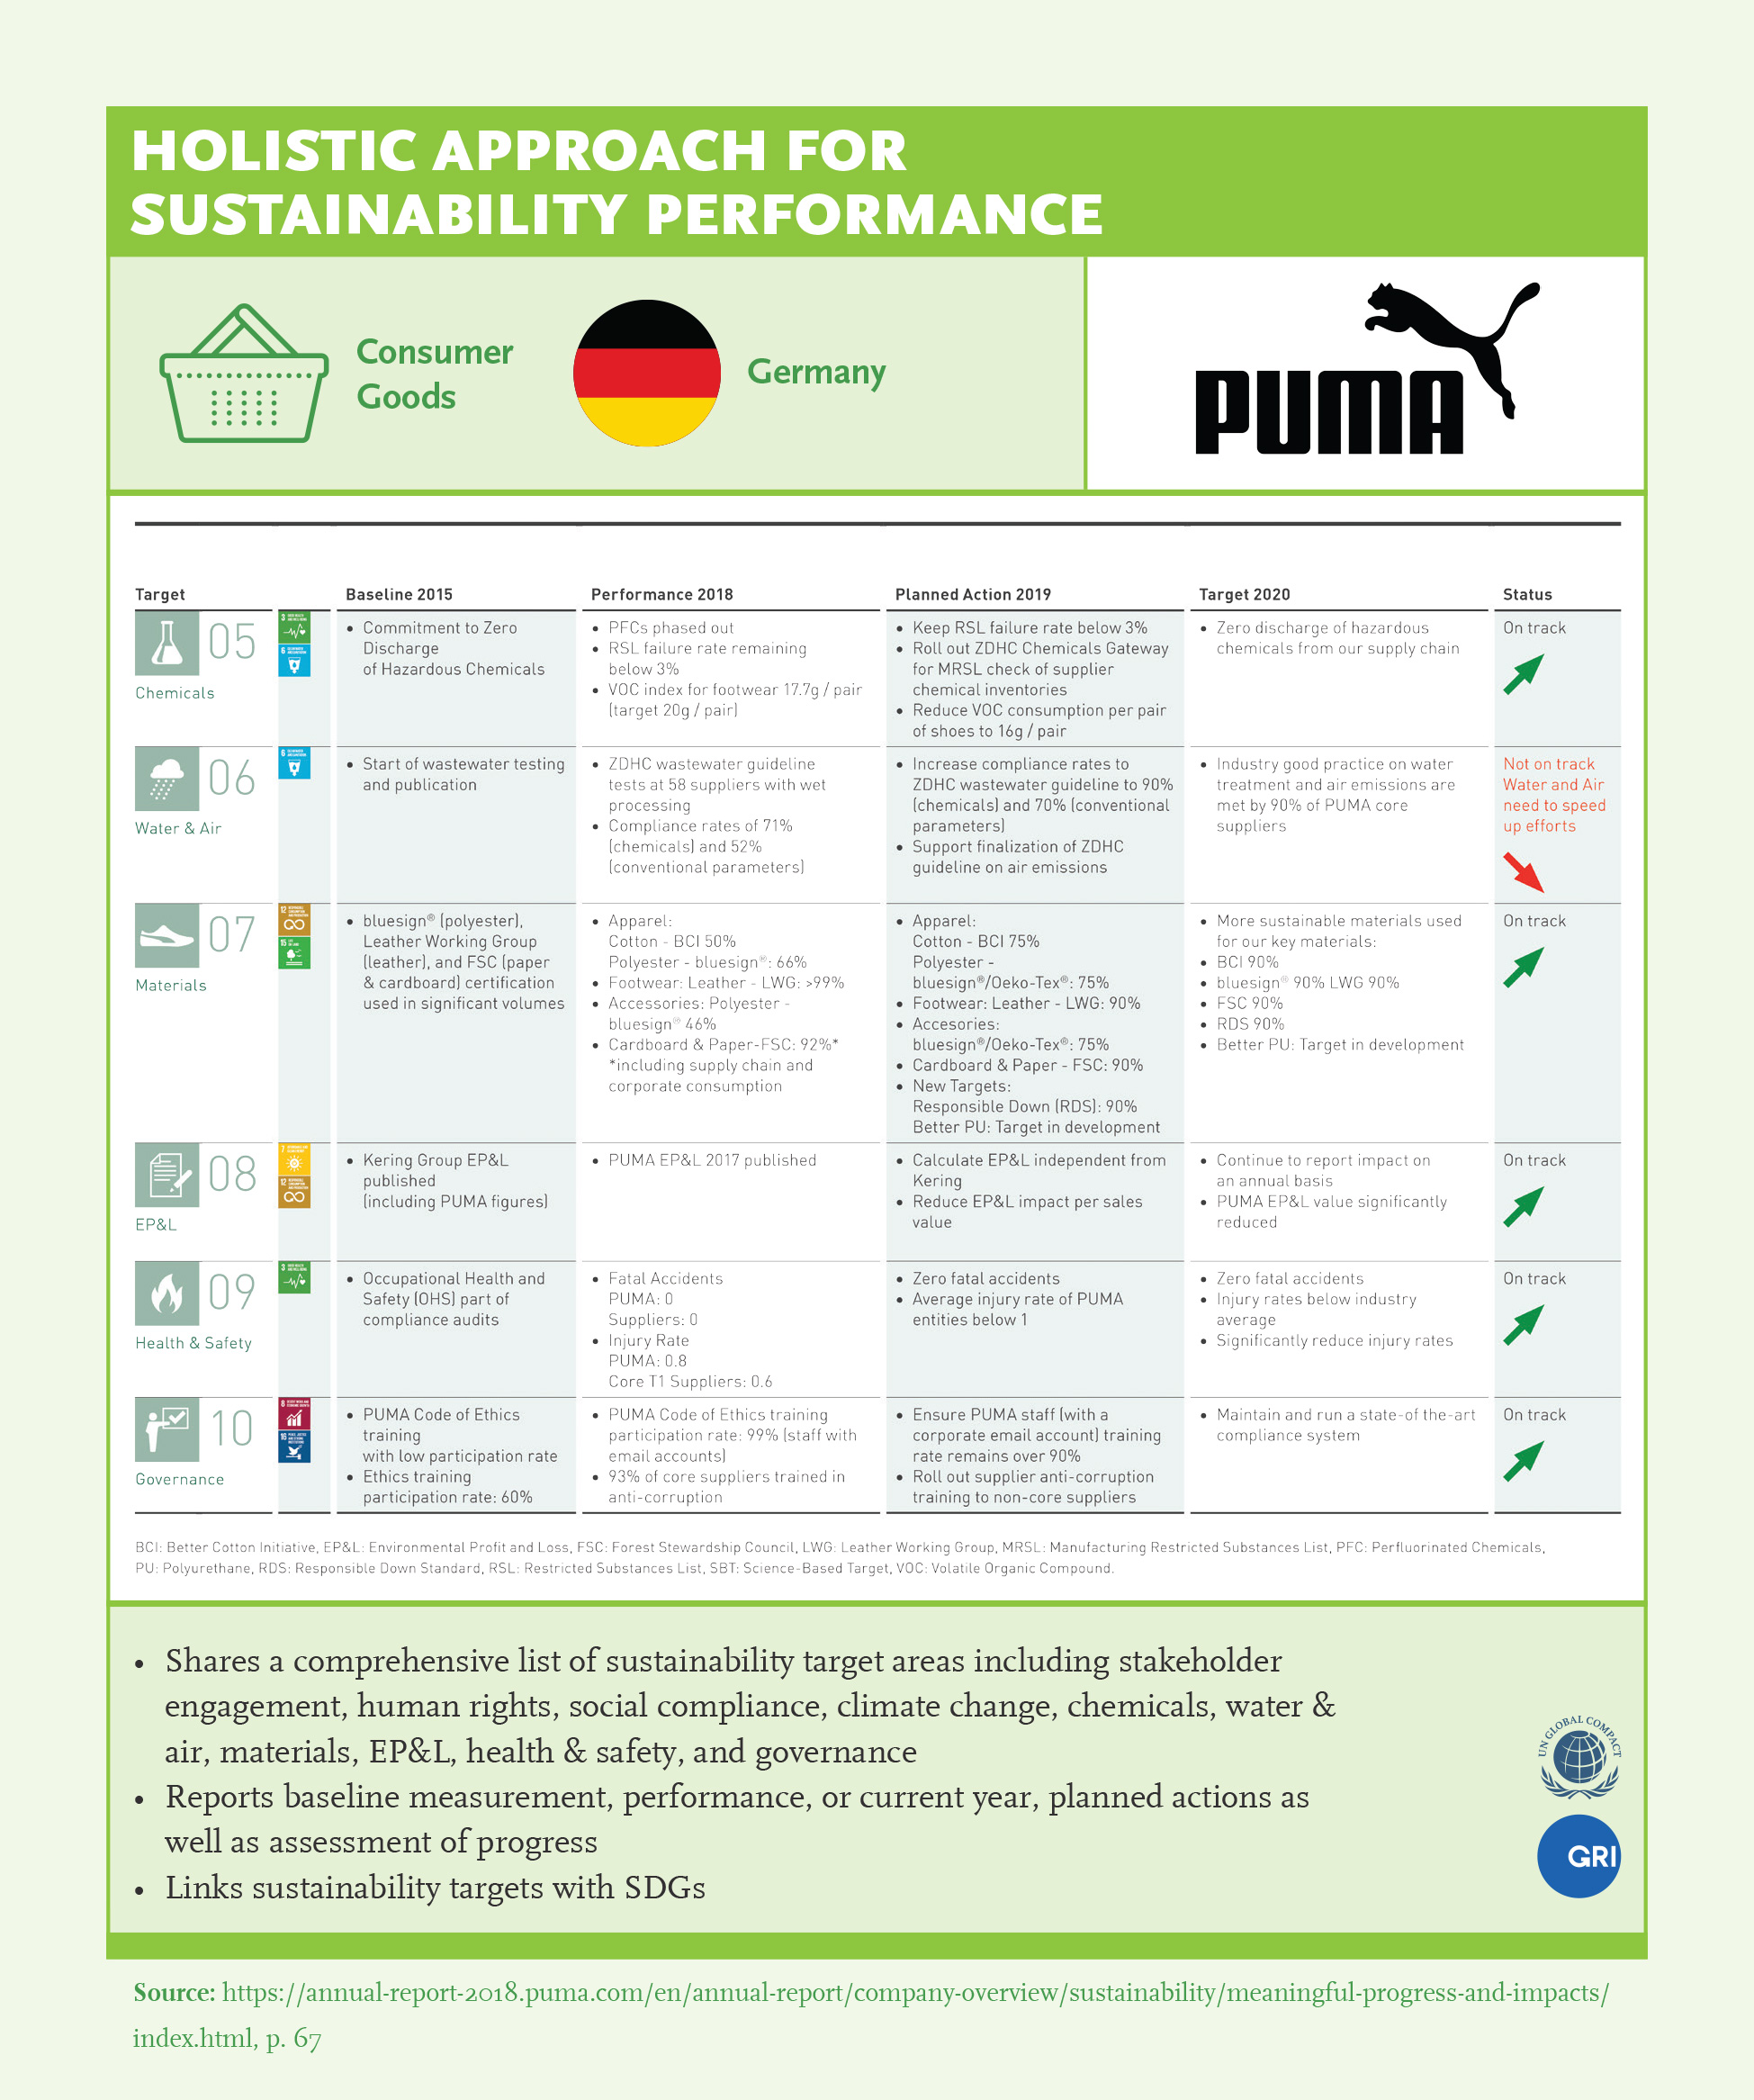
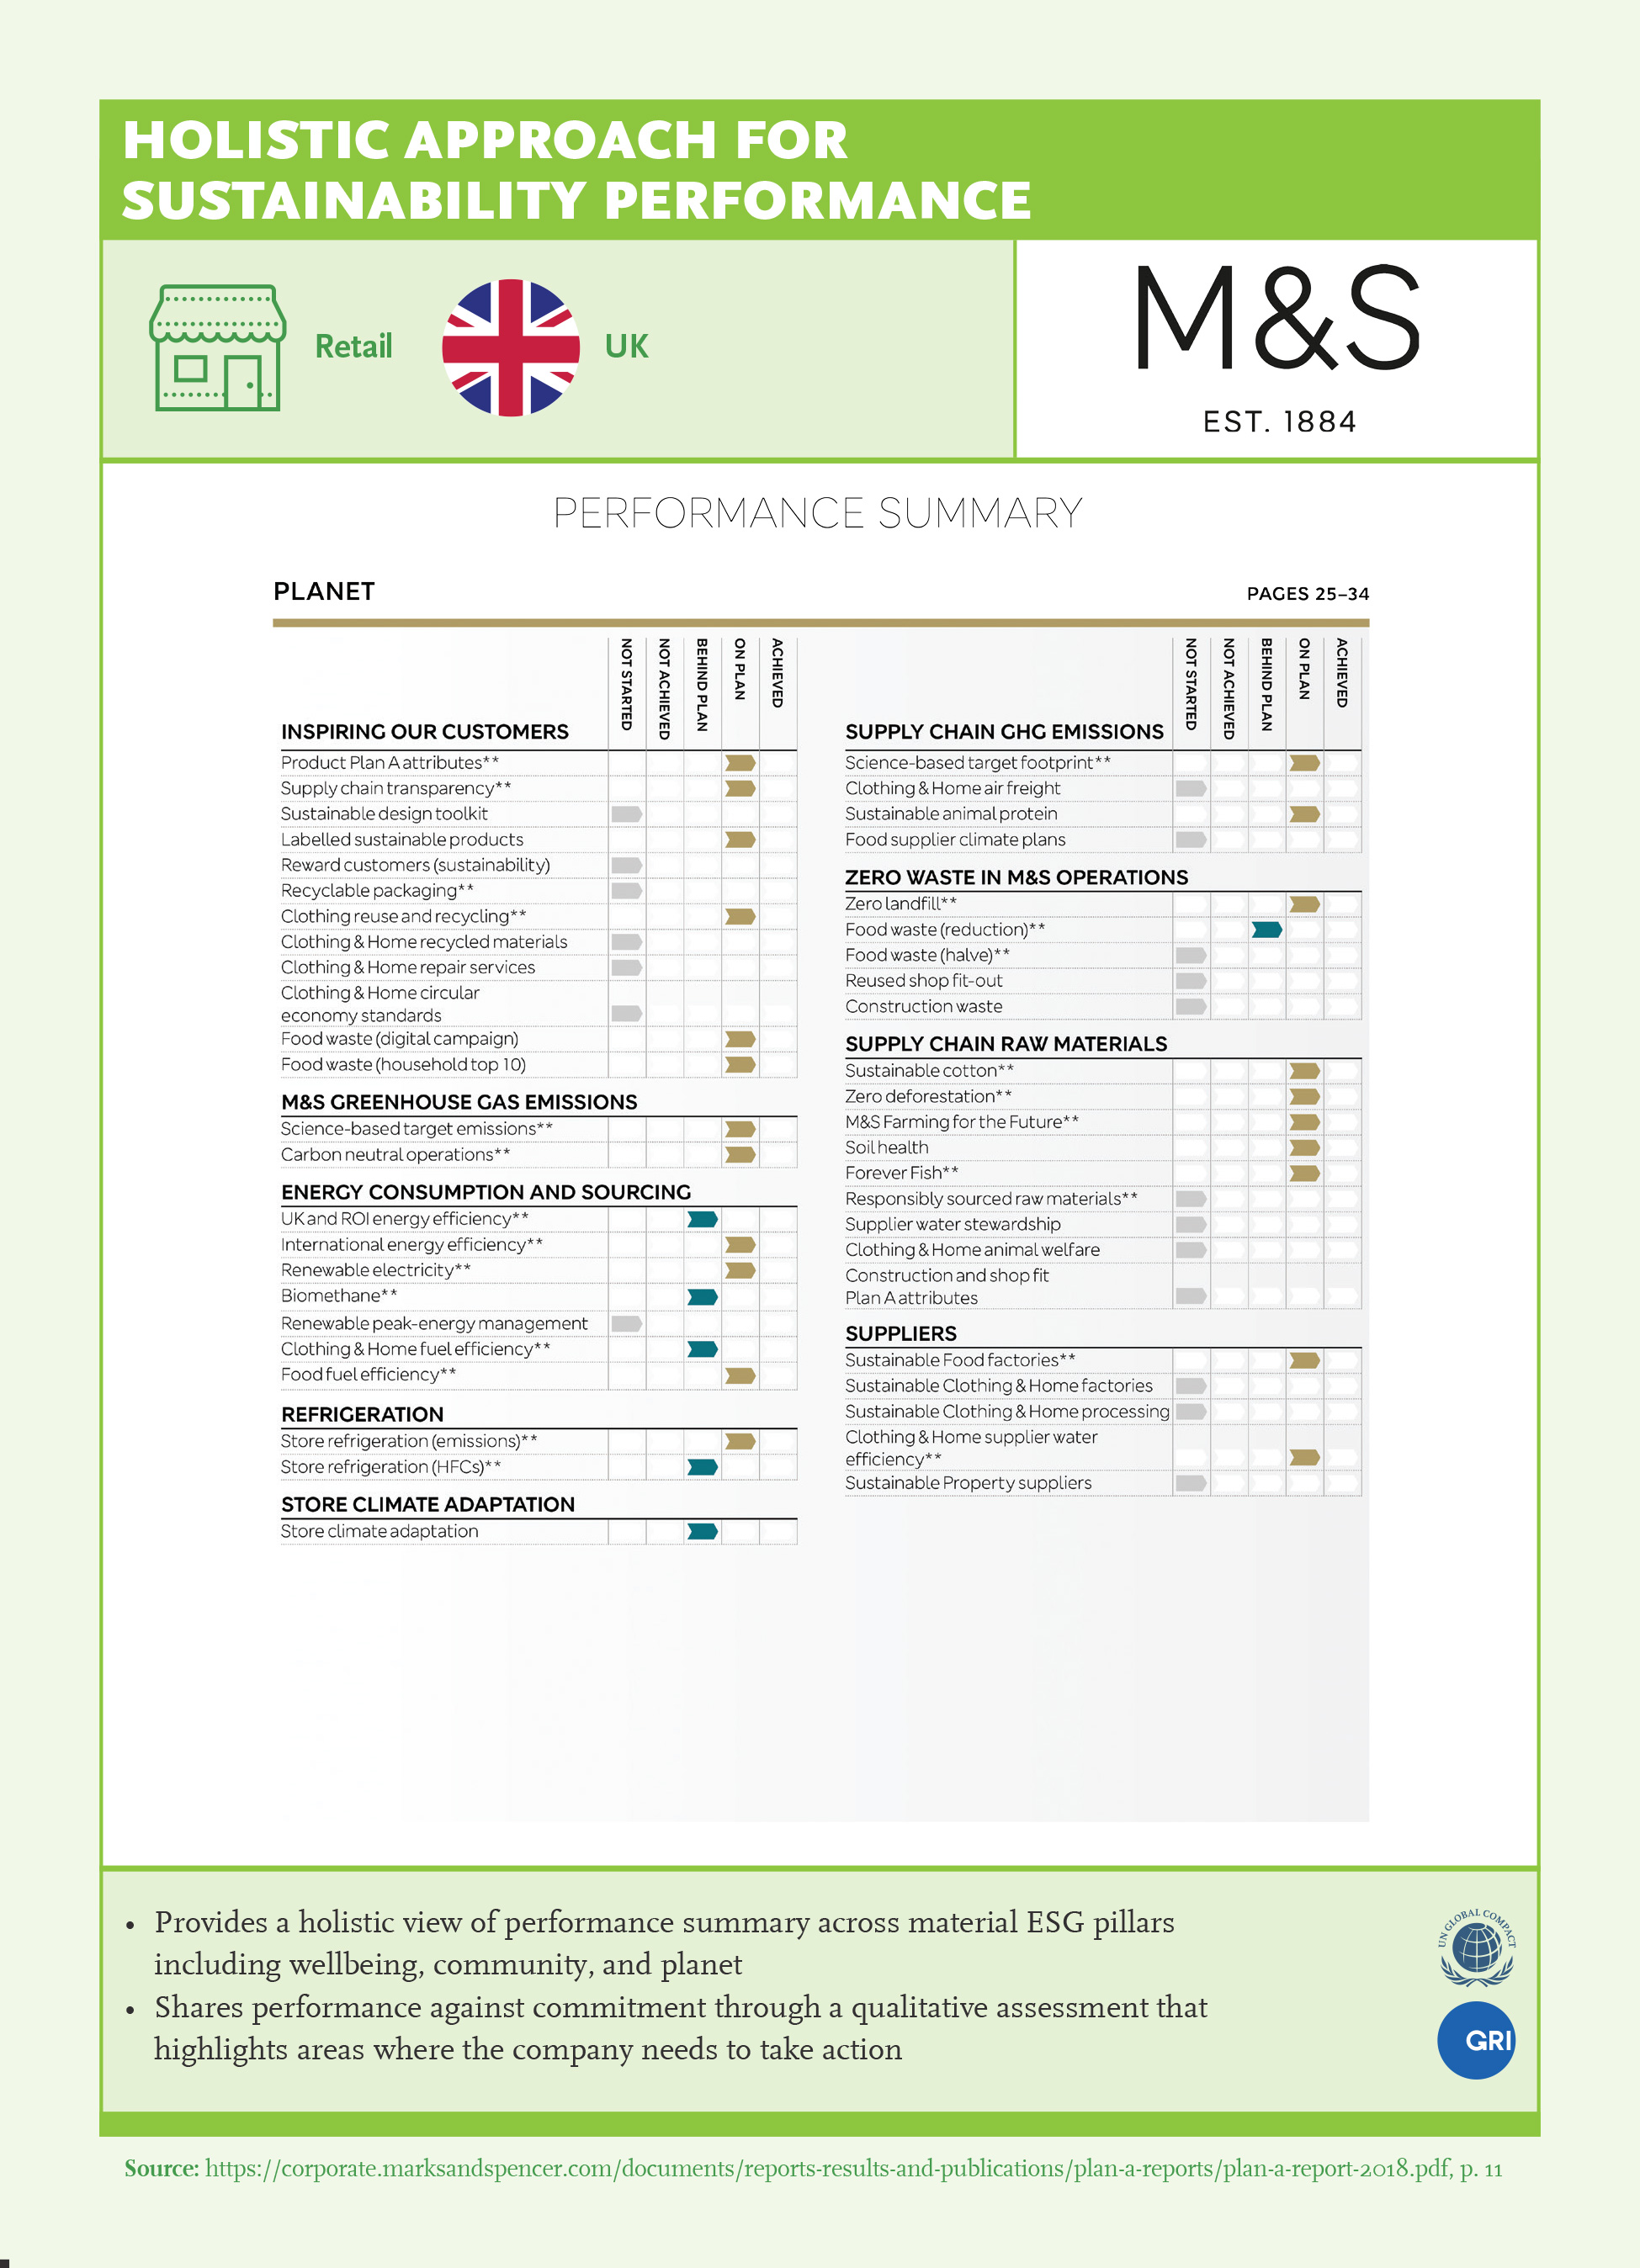
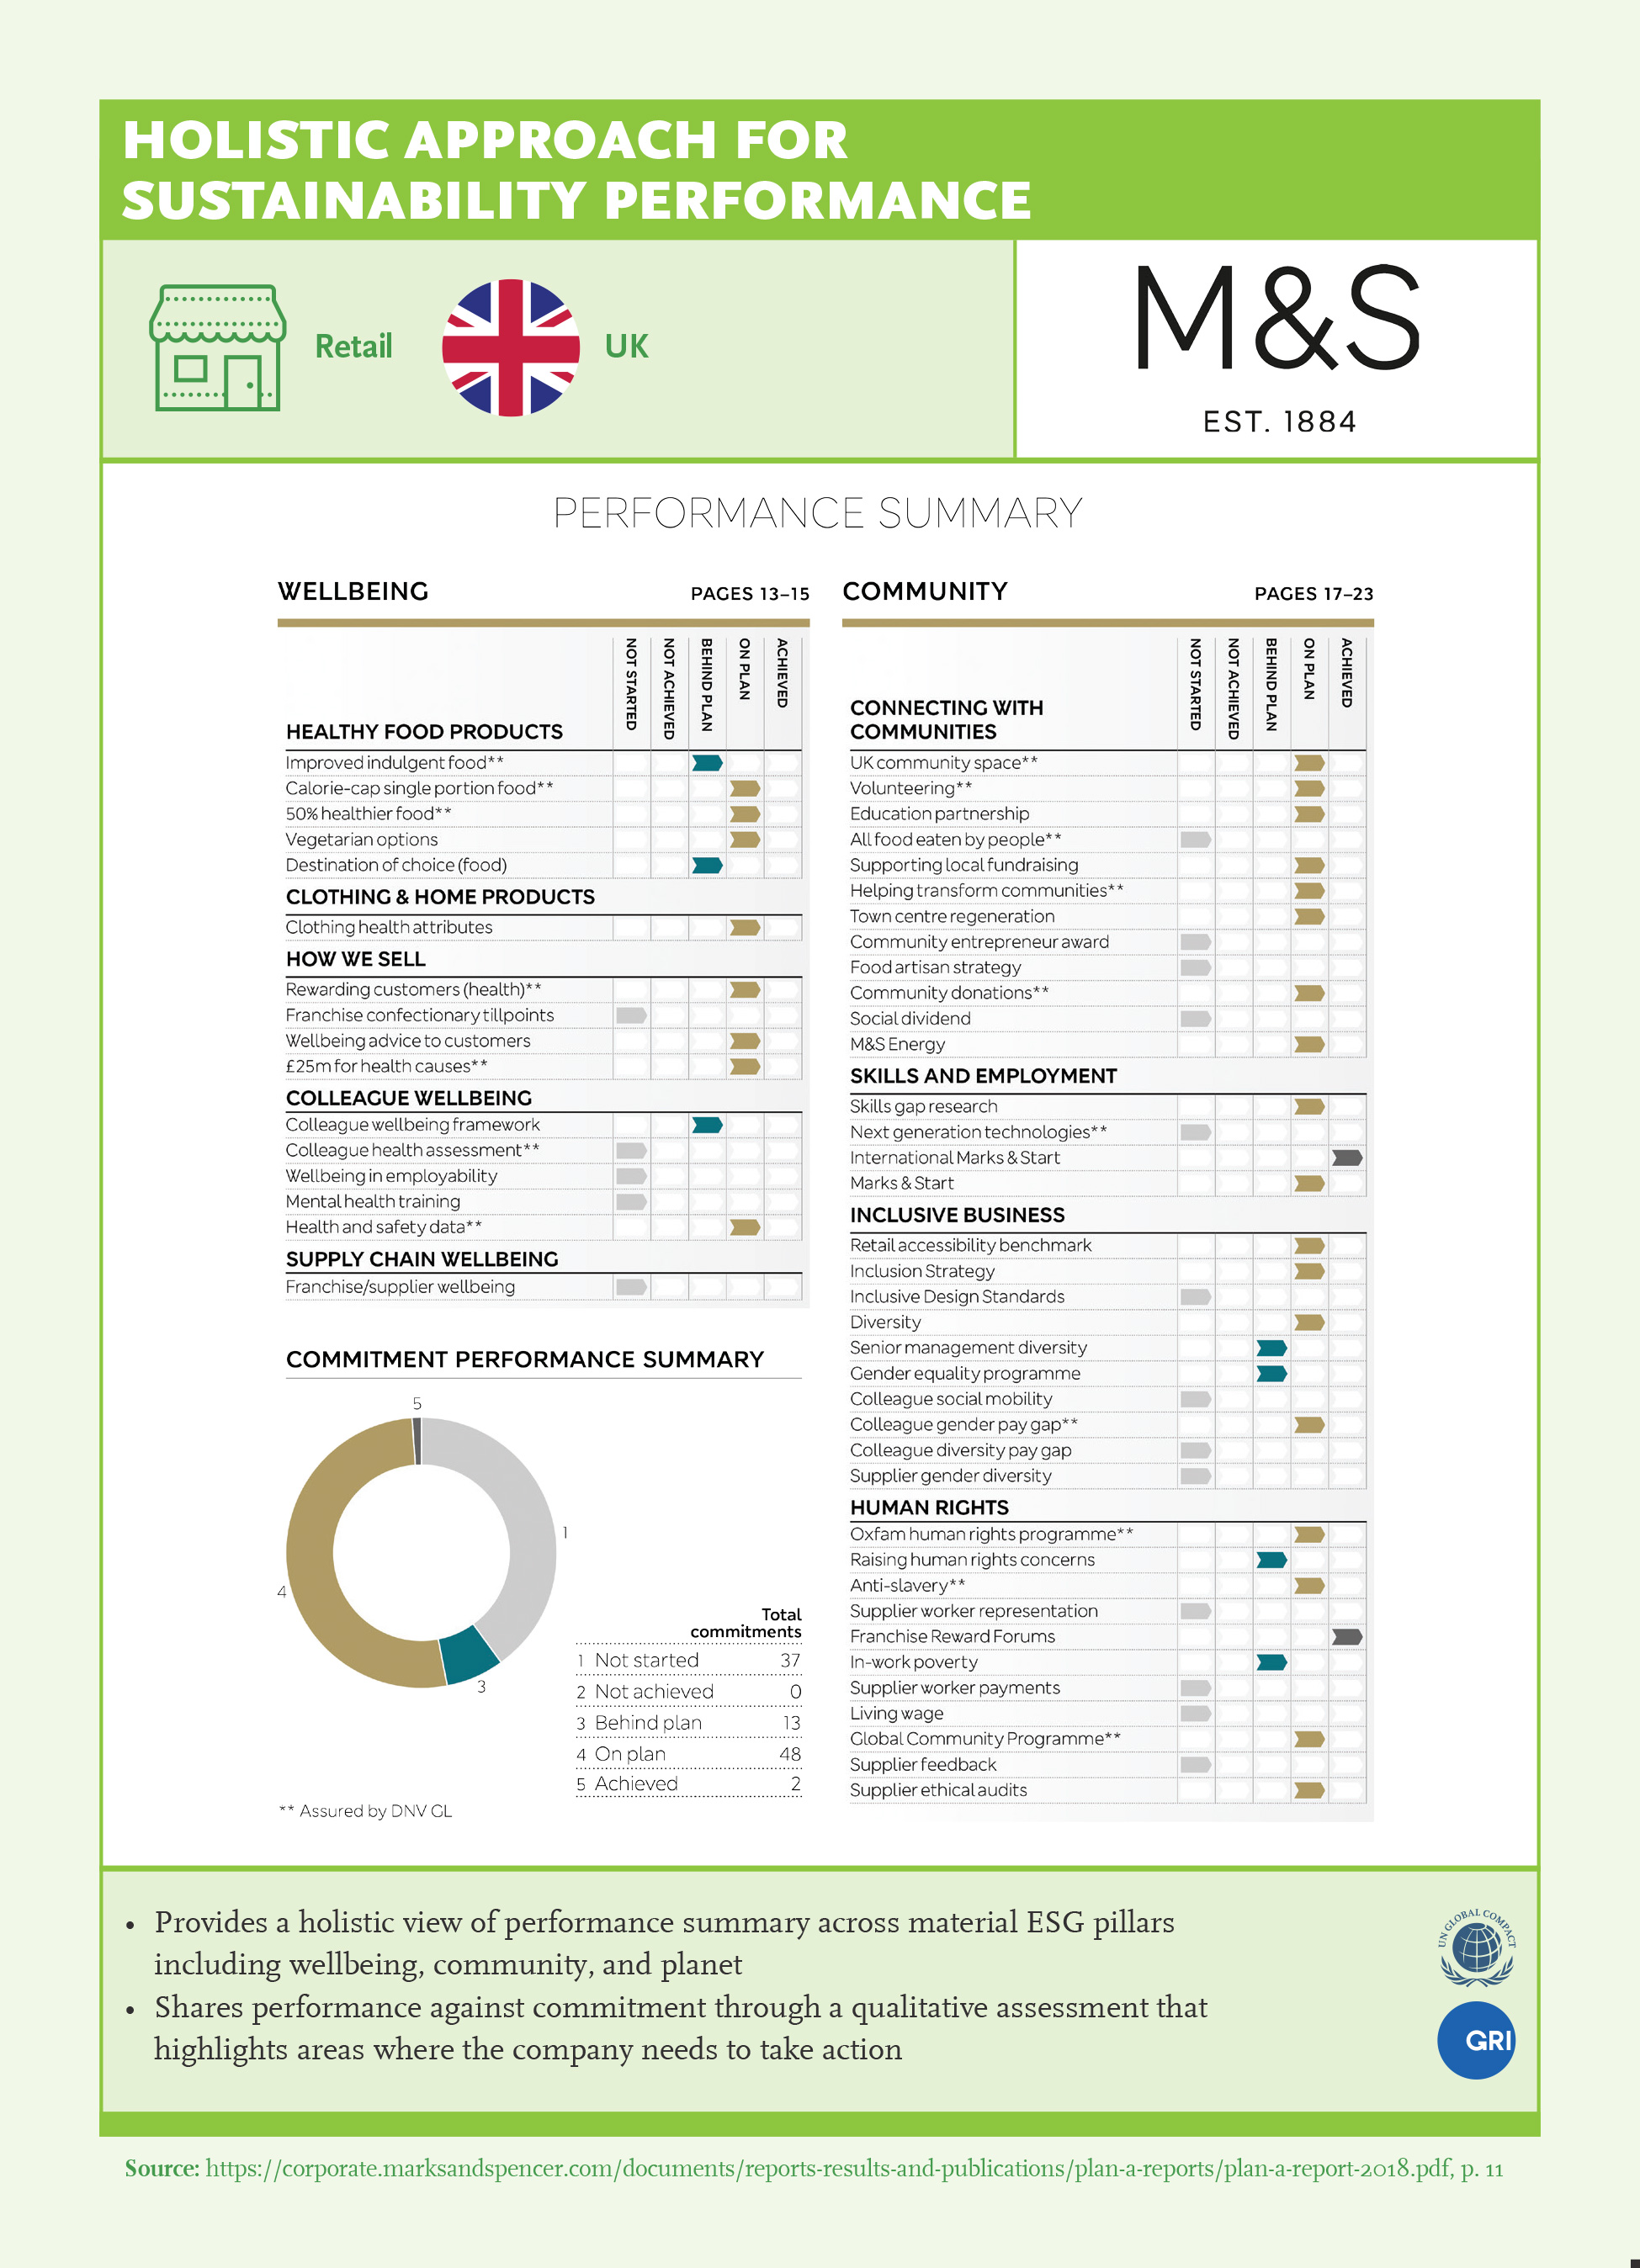
- 1Set ESG KPIs and SMART targets: Set them in line with what matters to focus attention on improving sustainability performance. Best in class companies show a holistic view of their sustainability performance by integrating ESG and financial metrics and disclosing performance against these metrics. (Ex: Puma, Marks & Spencer)
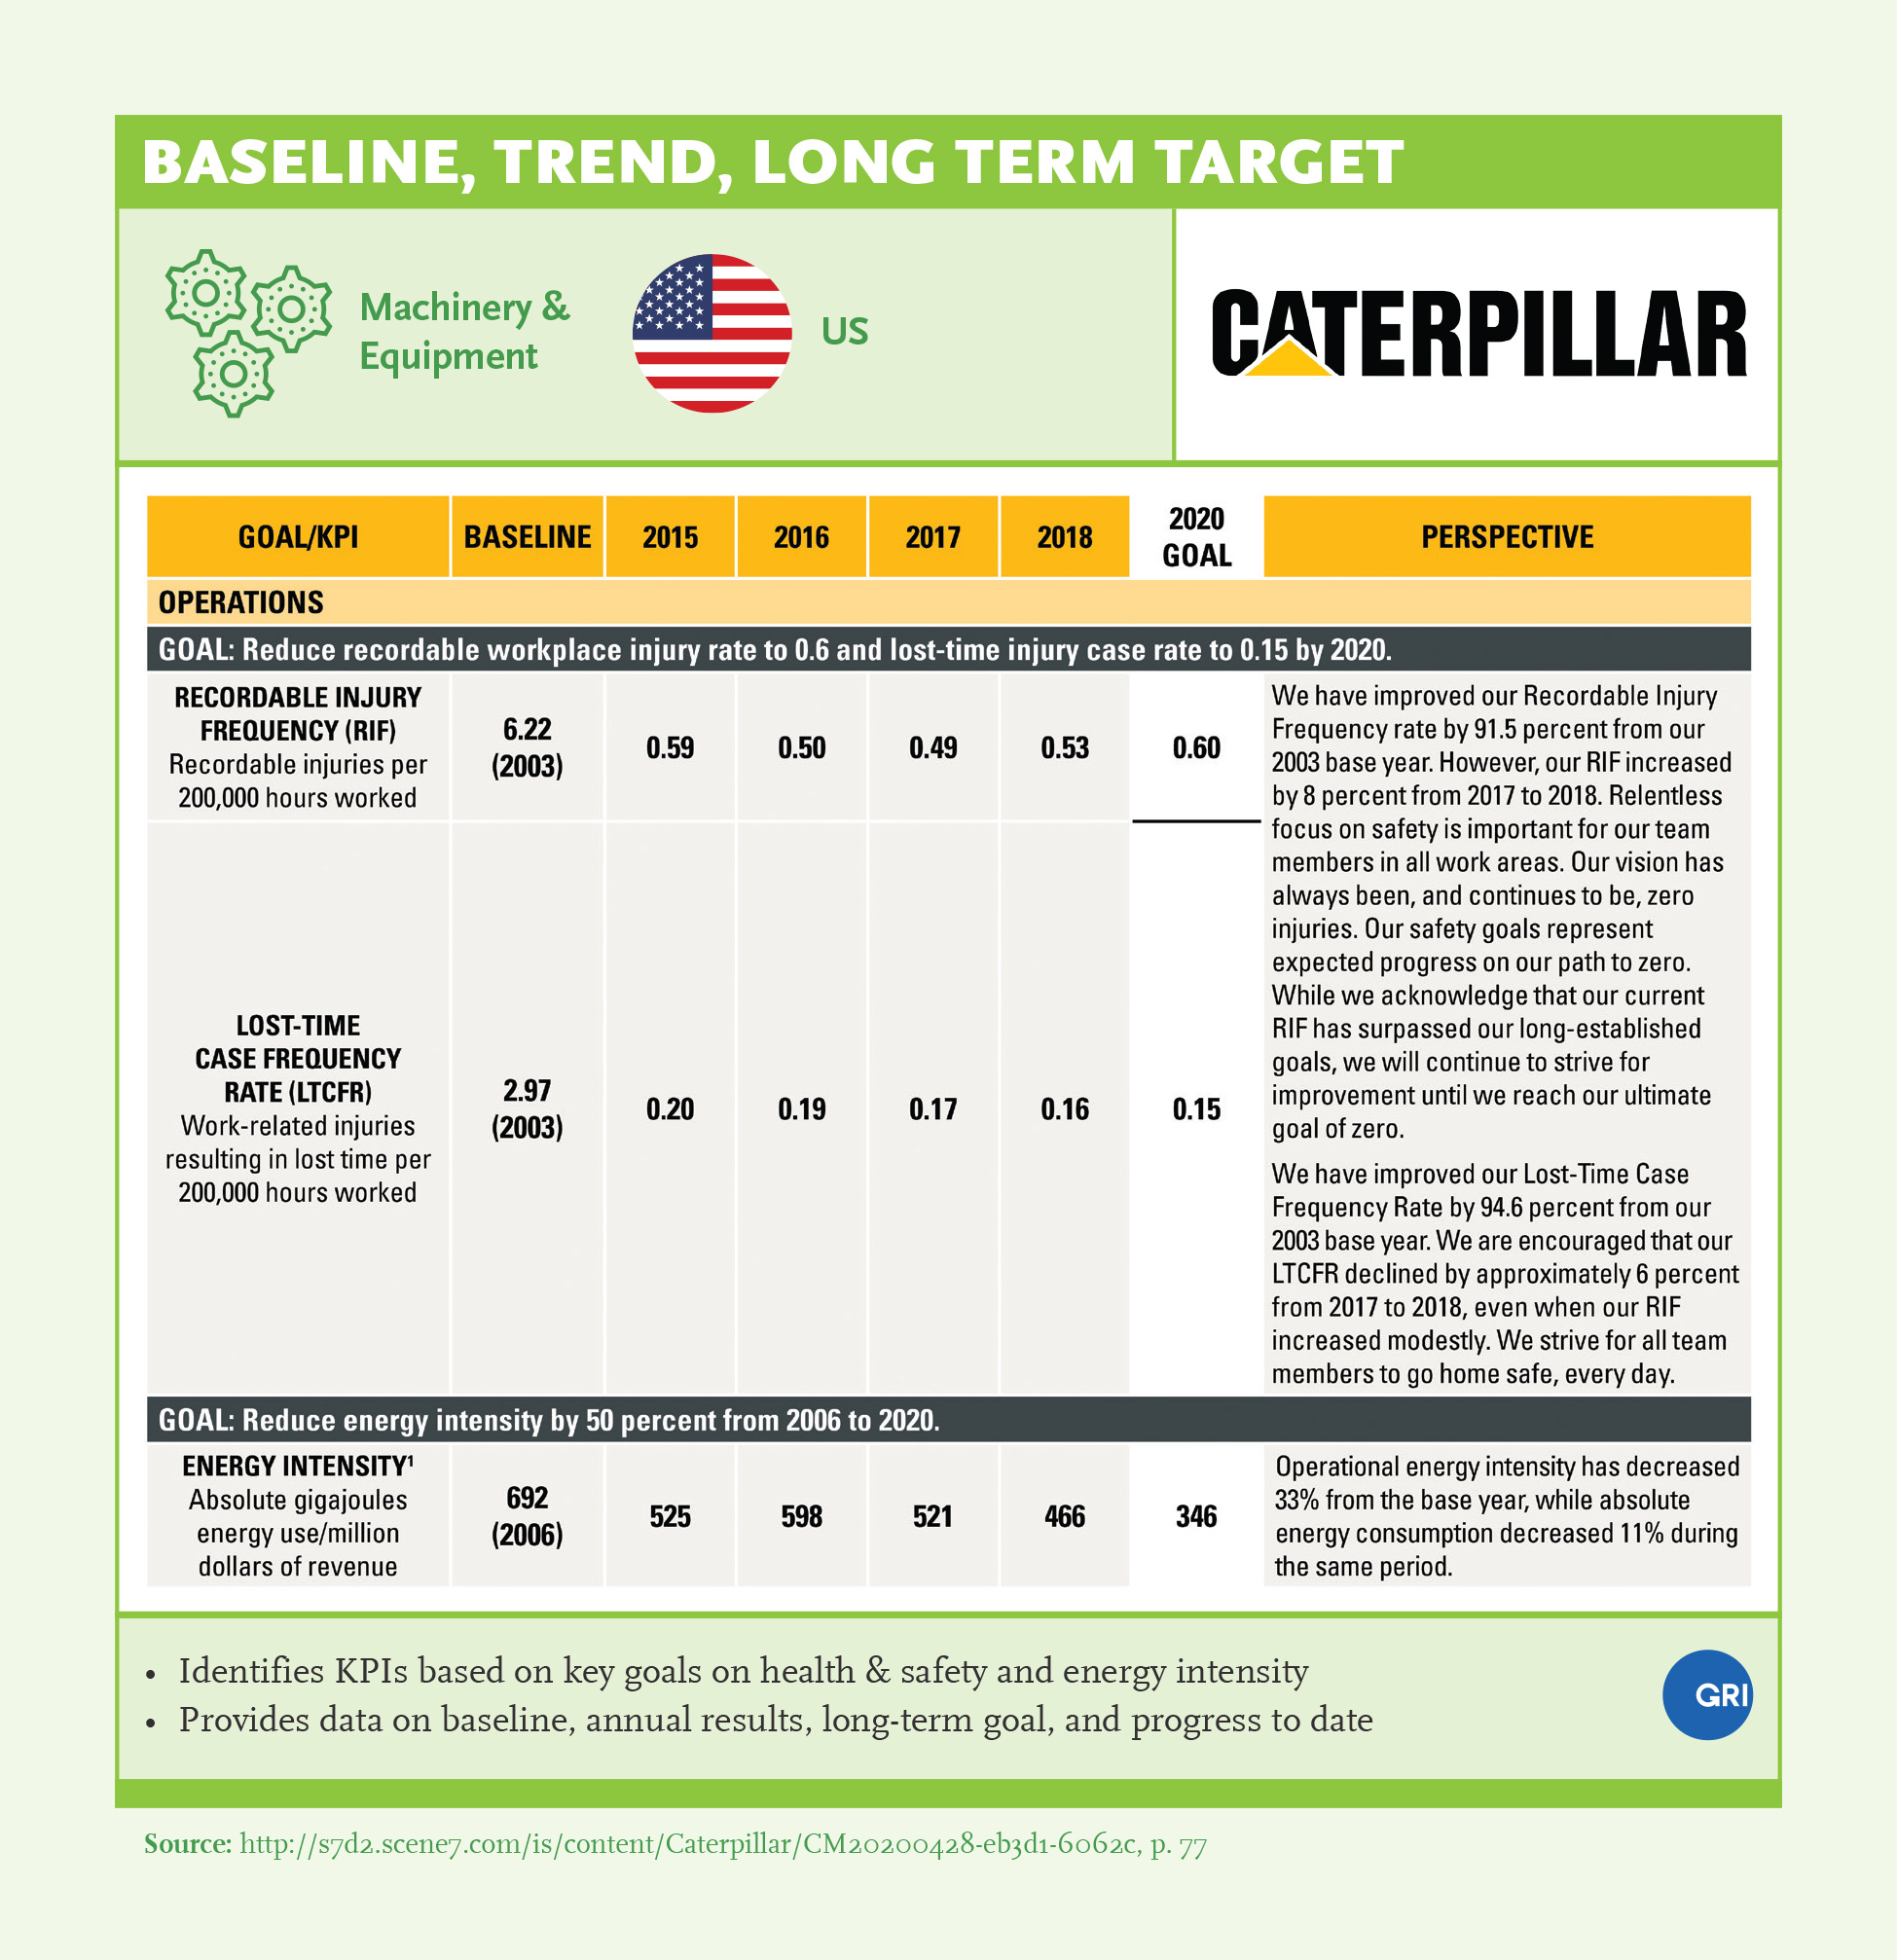
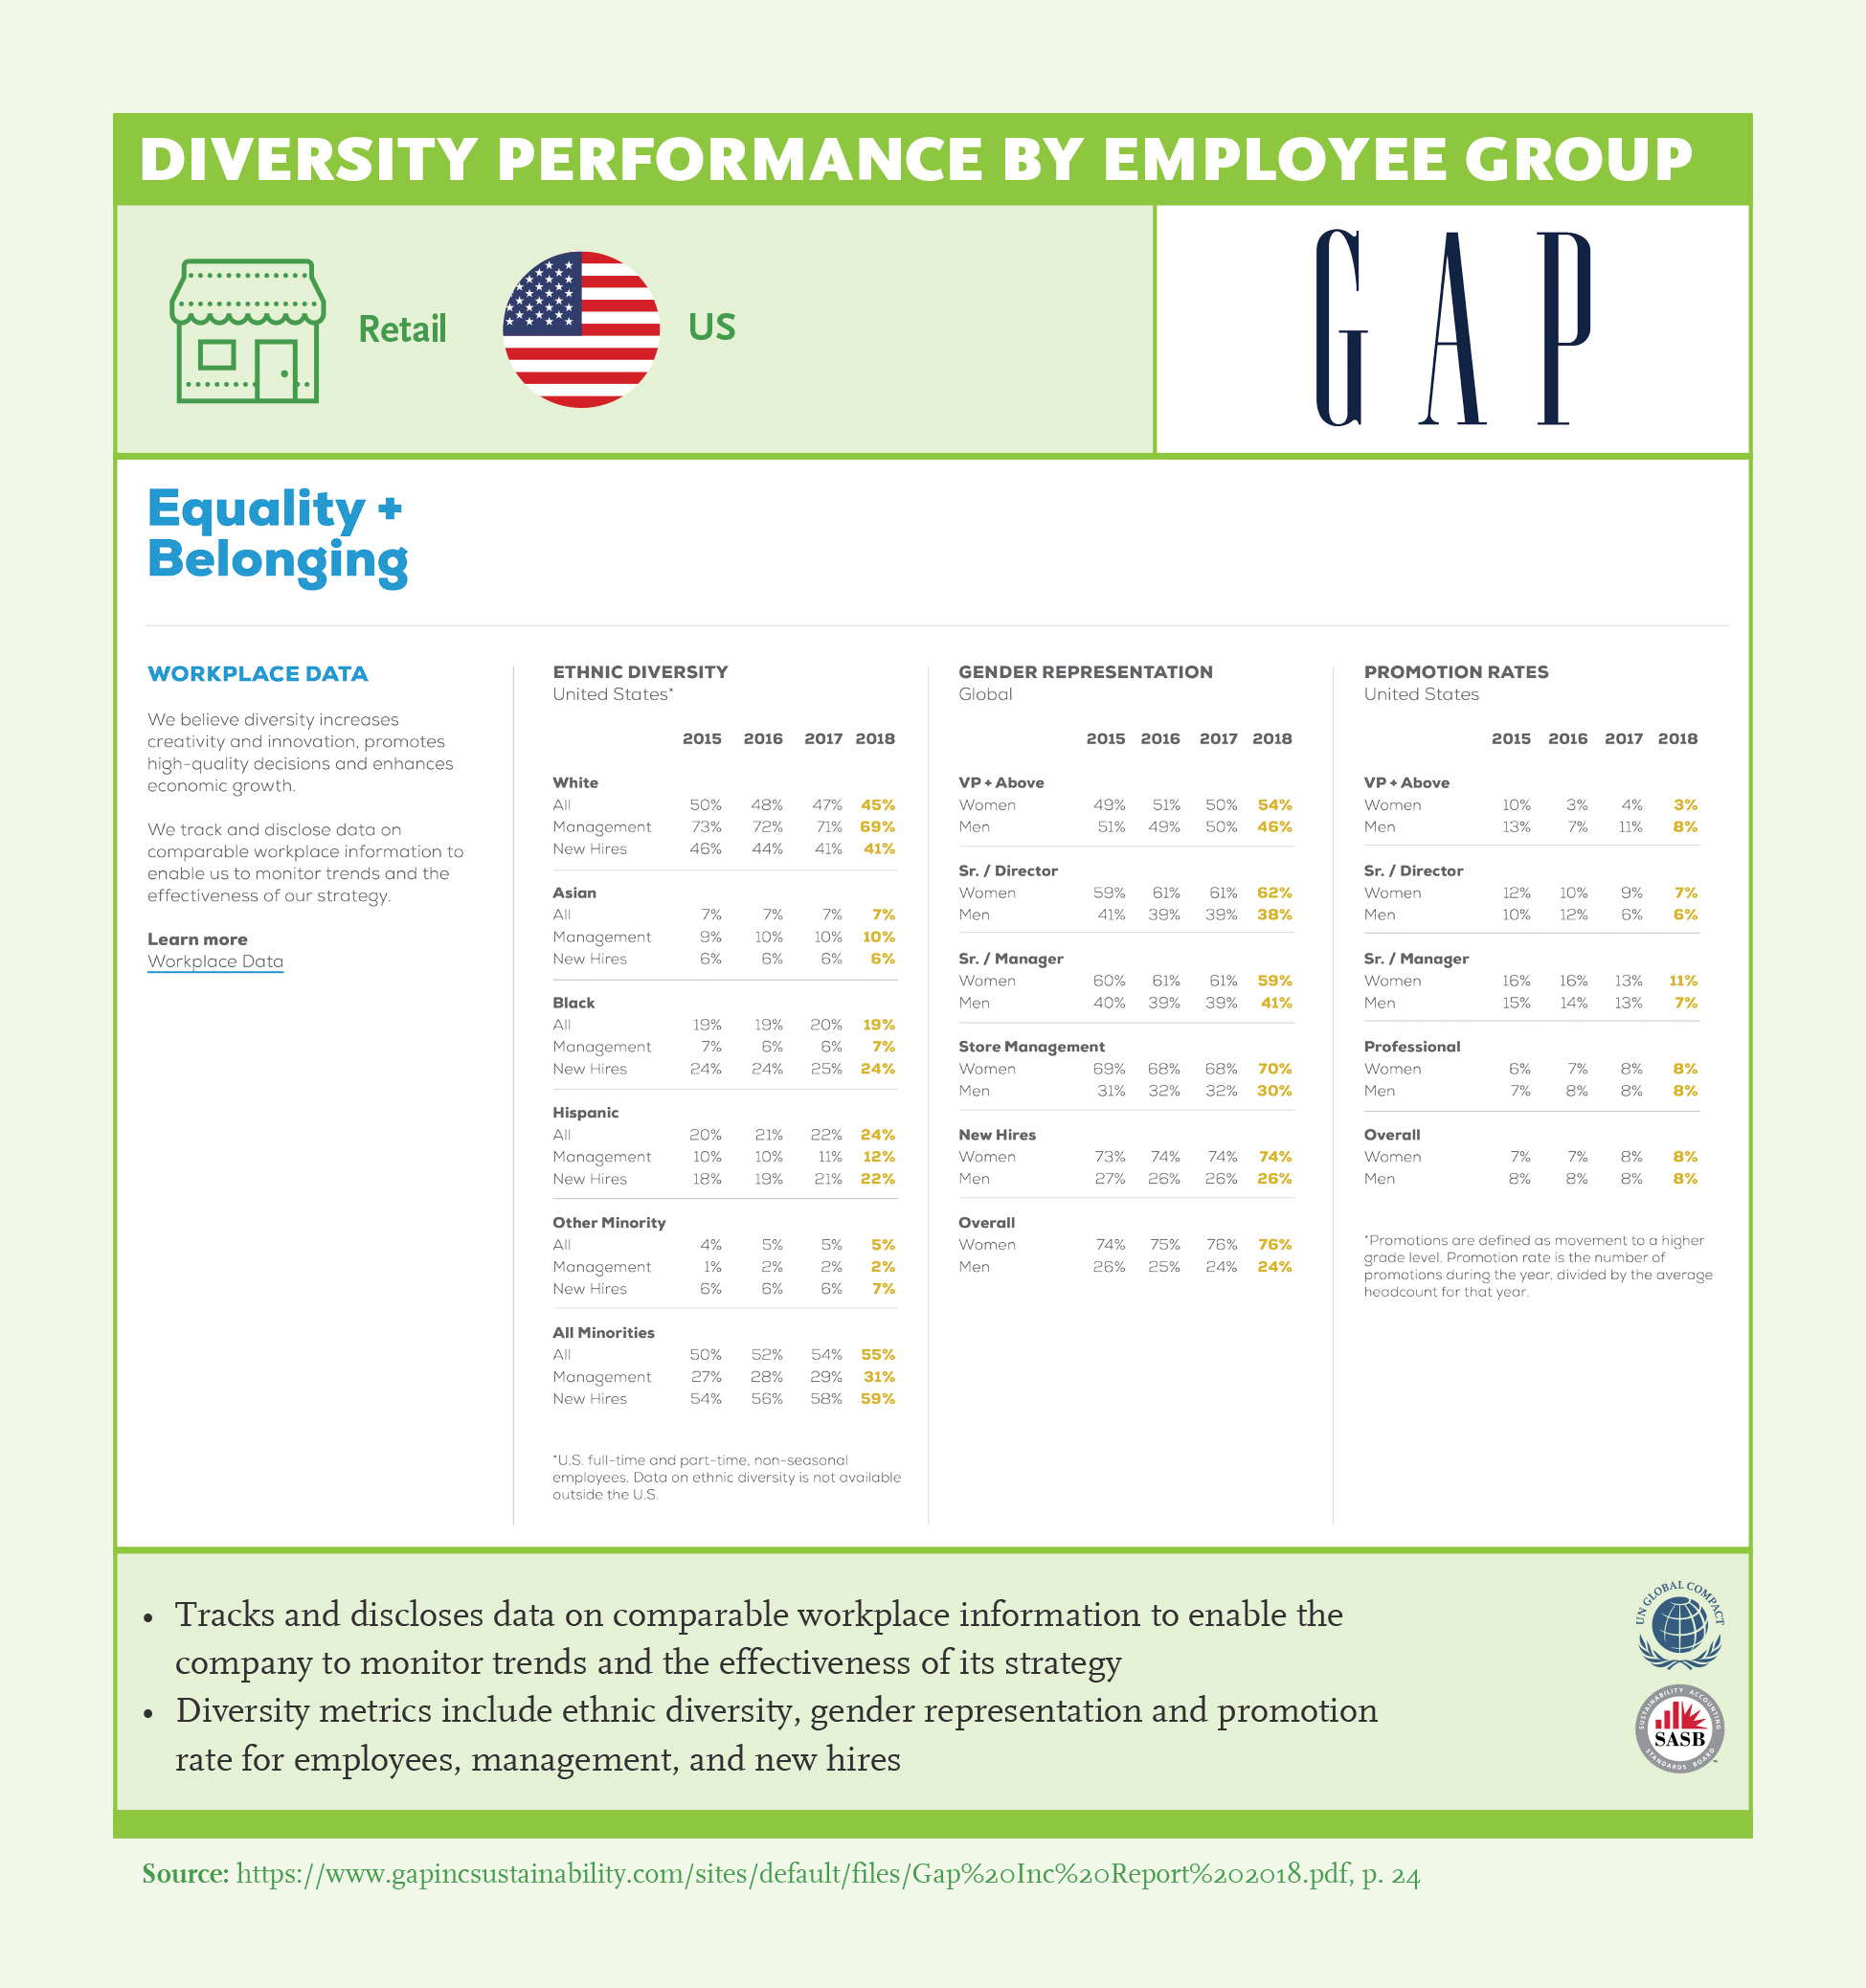
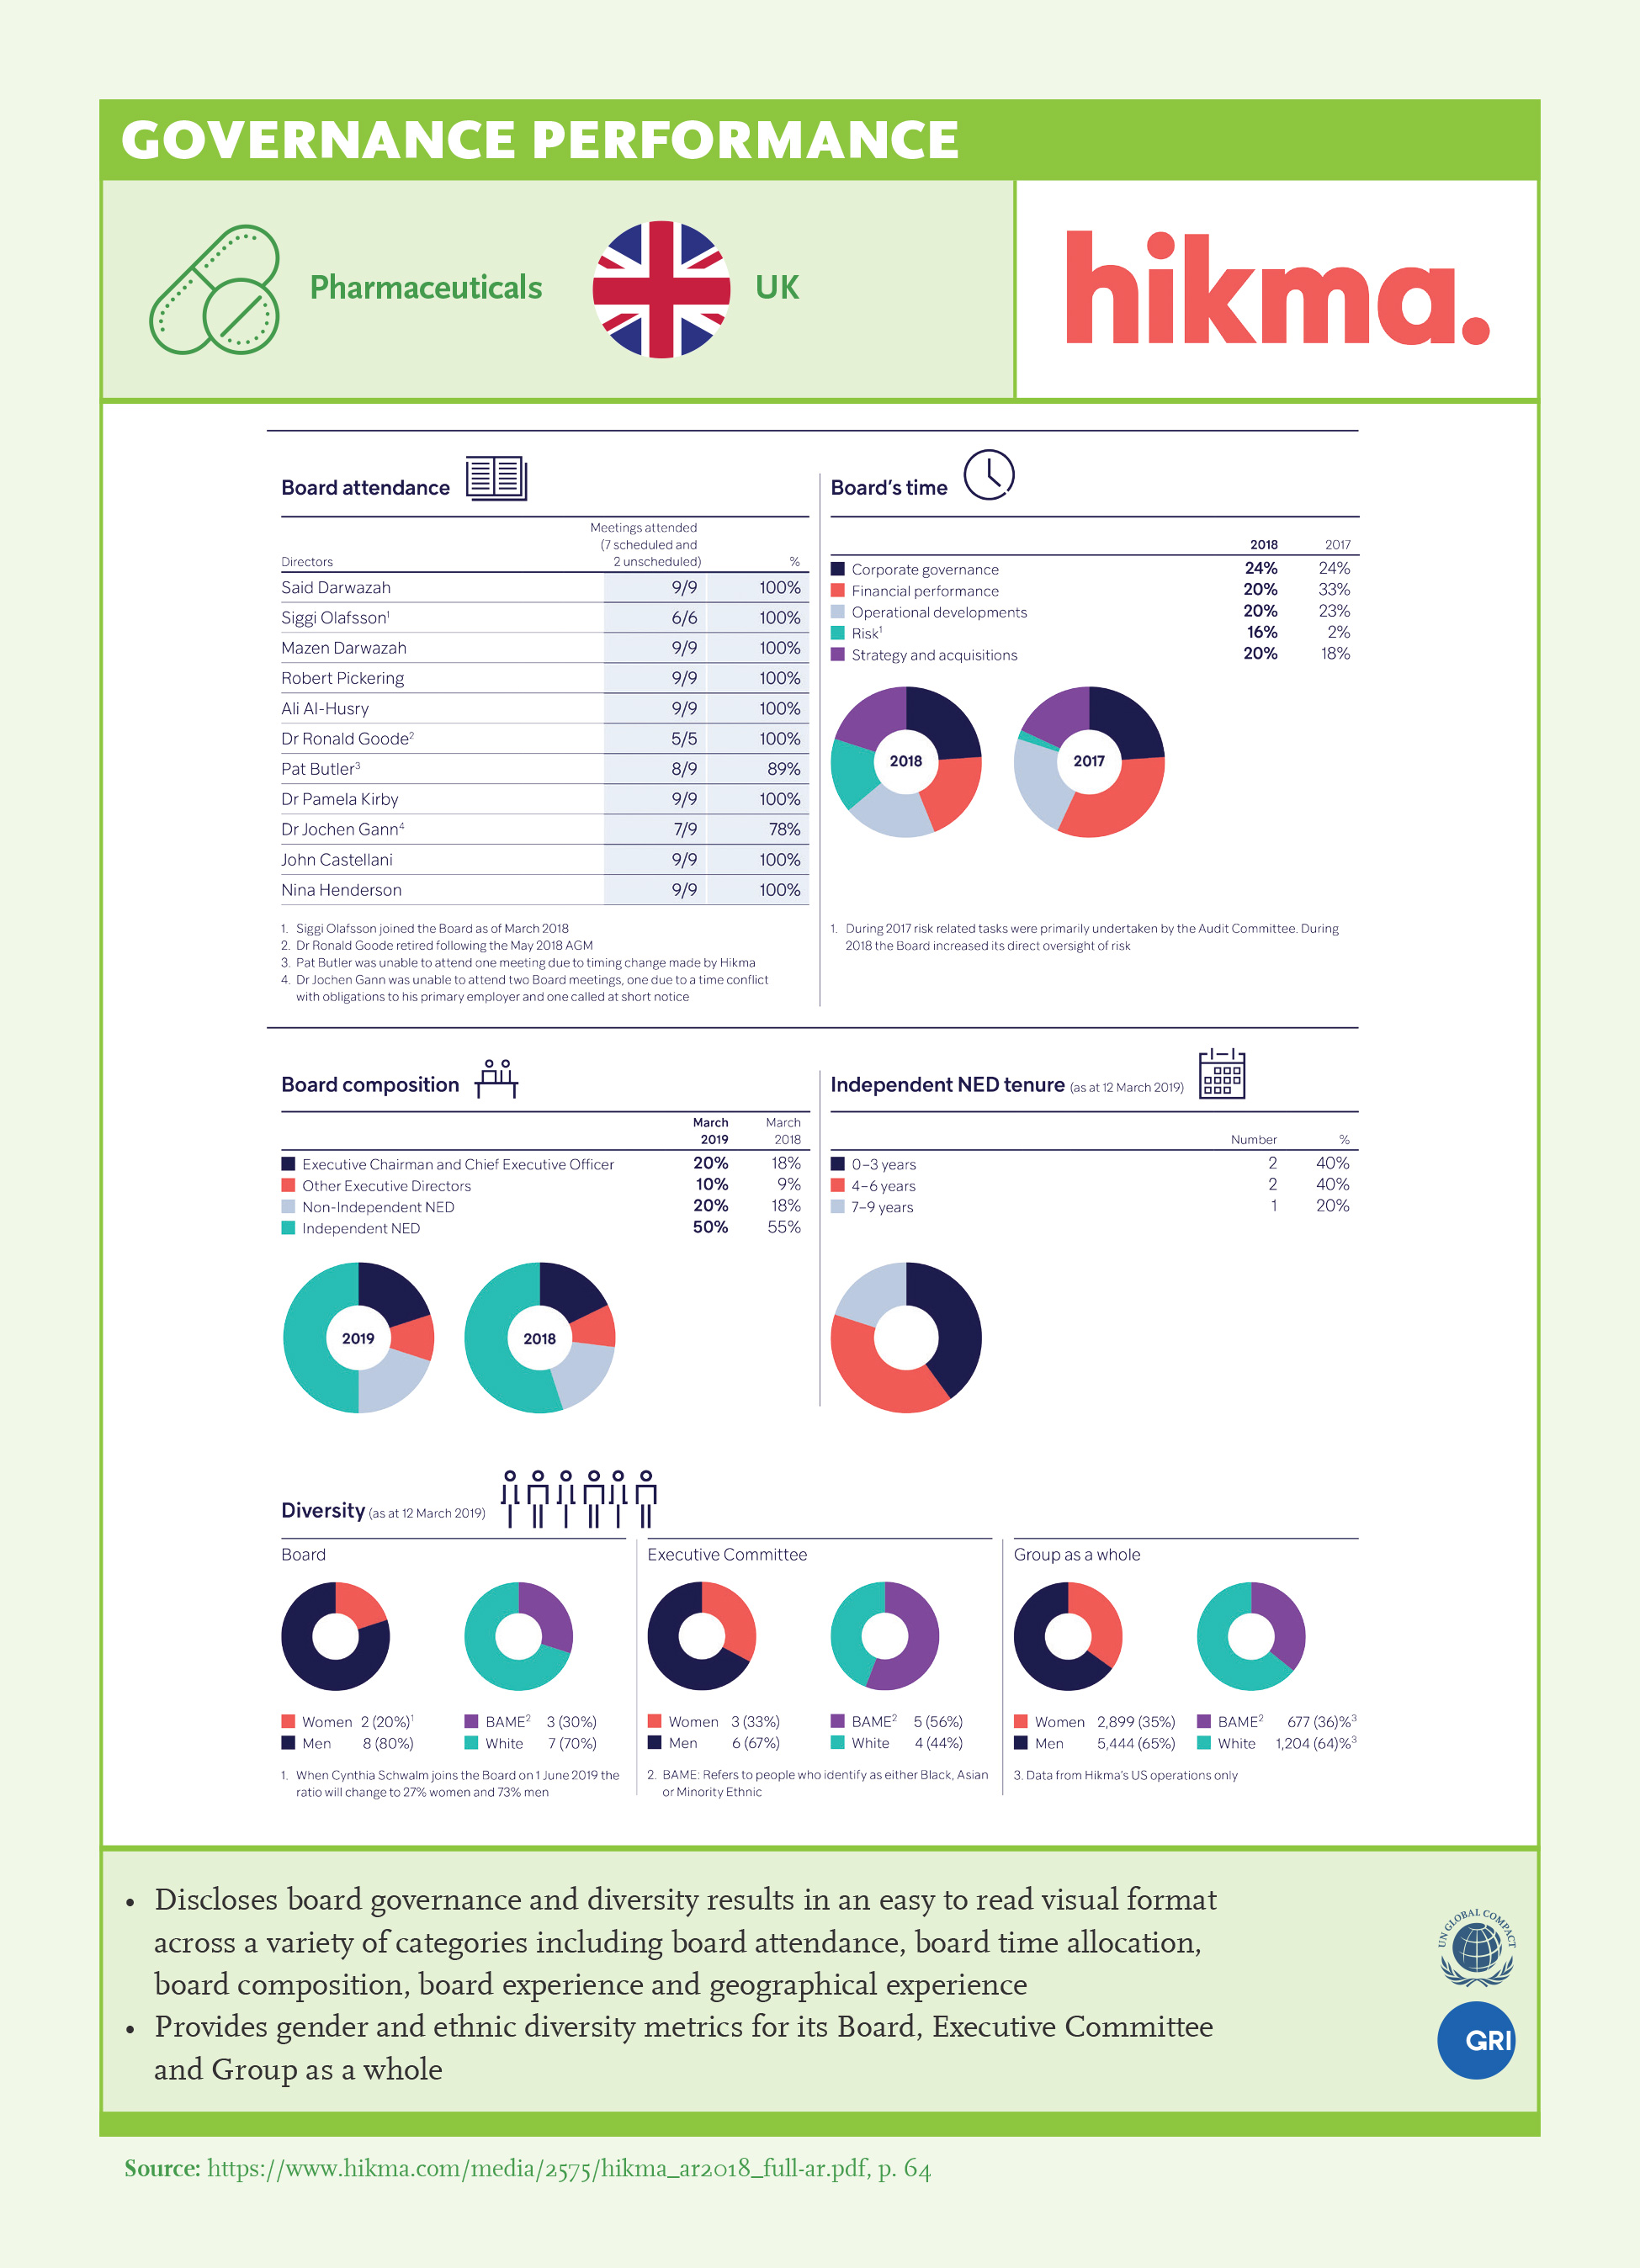
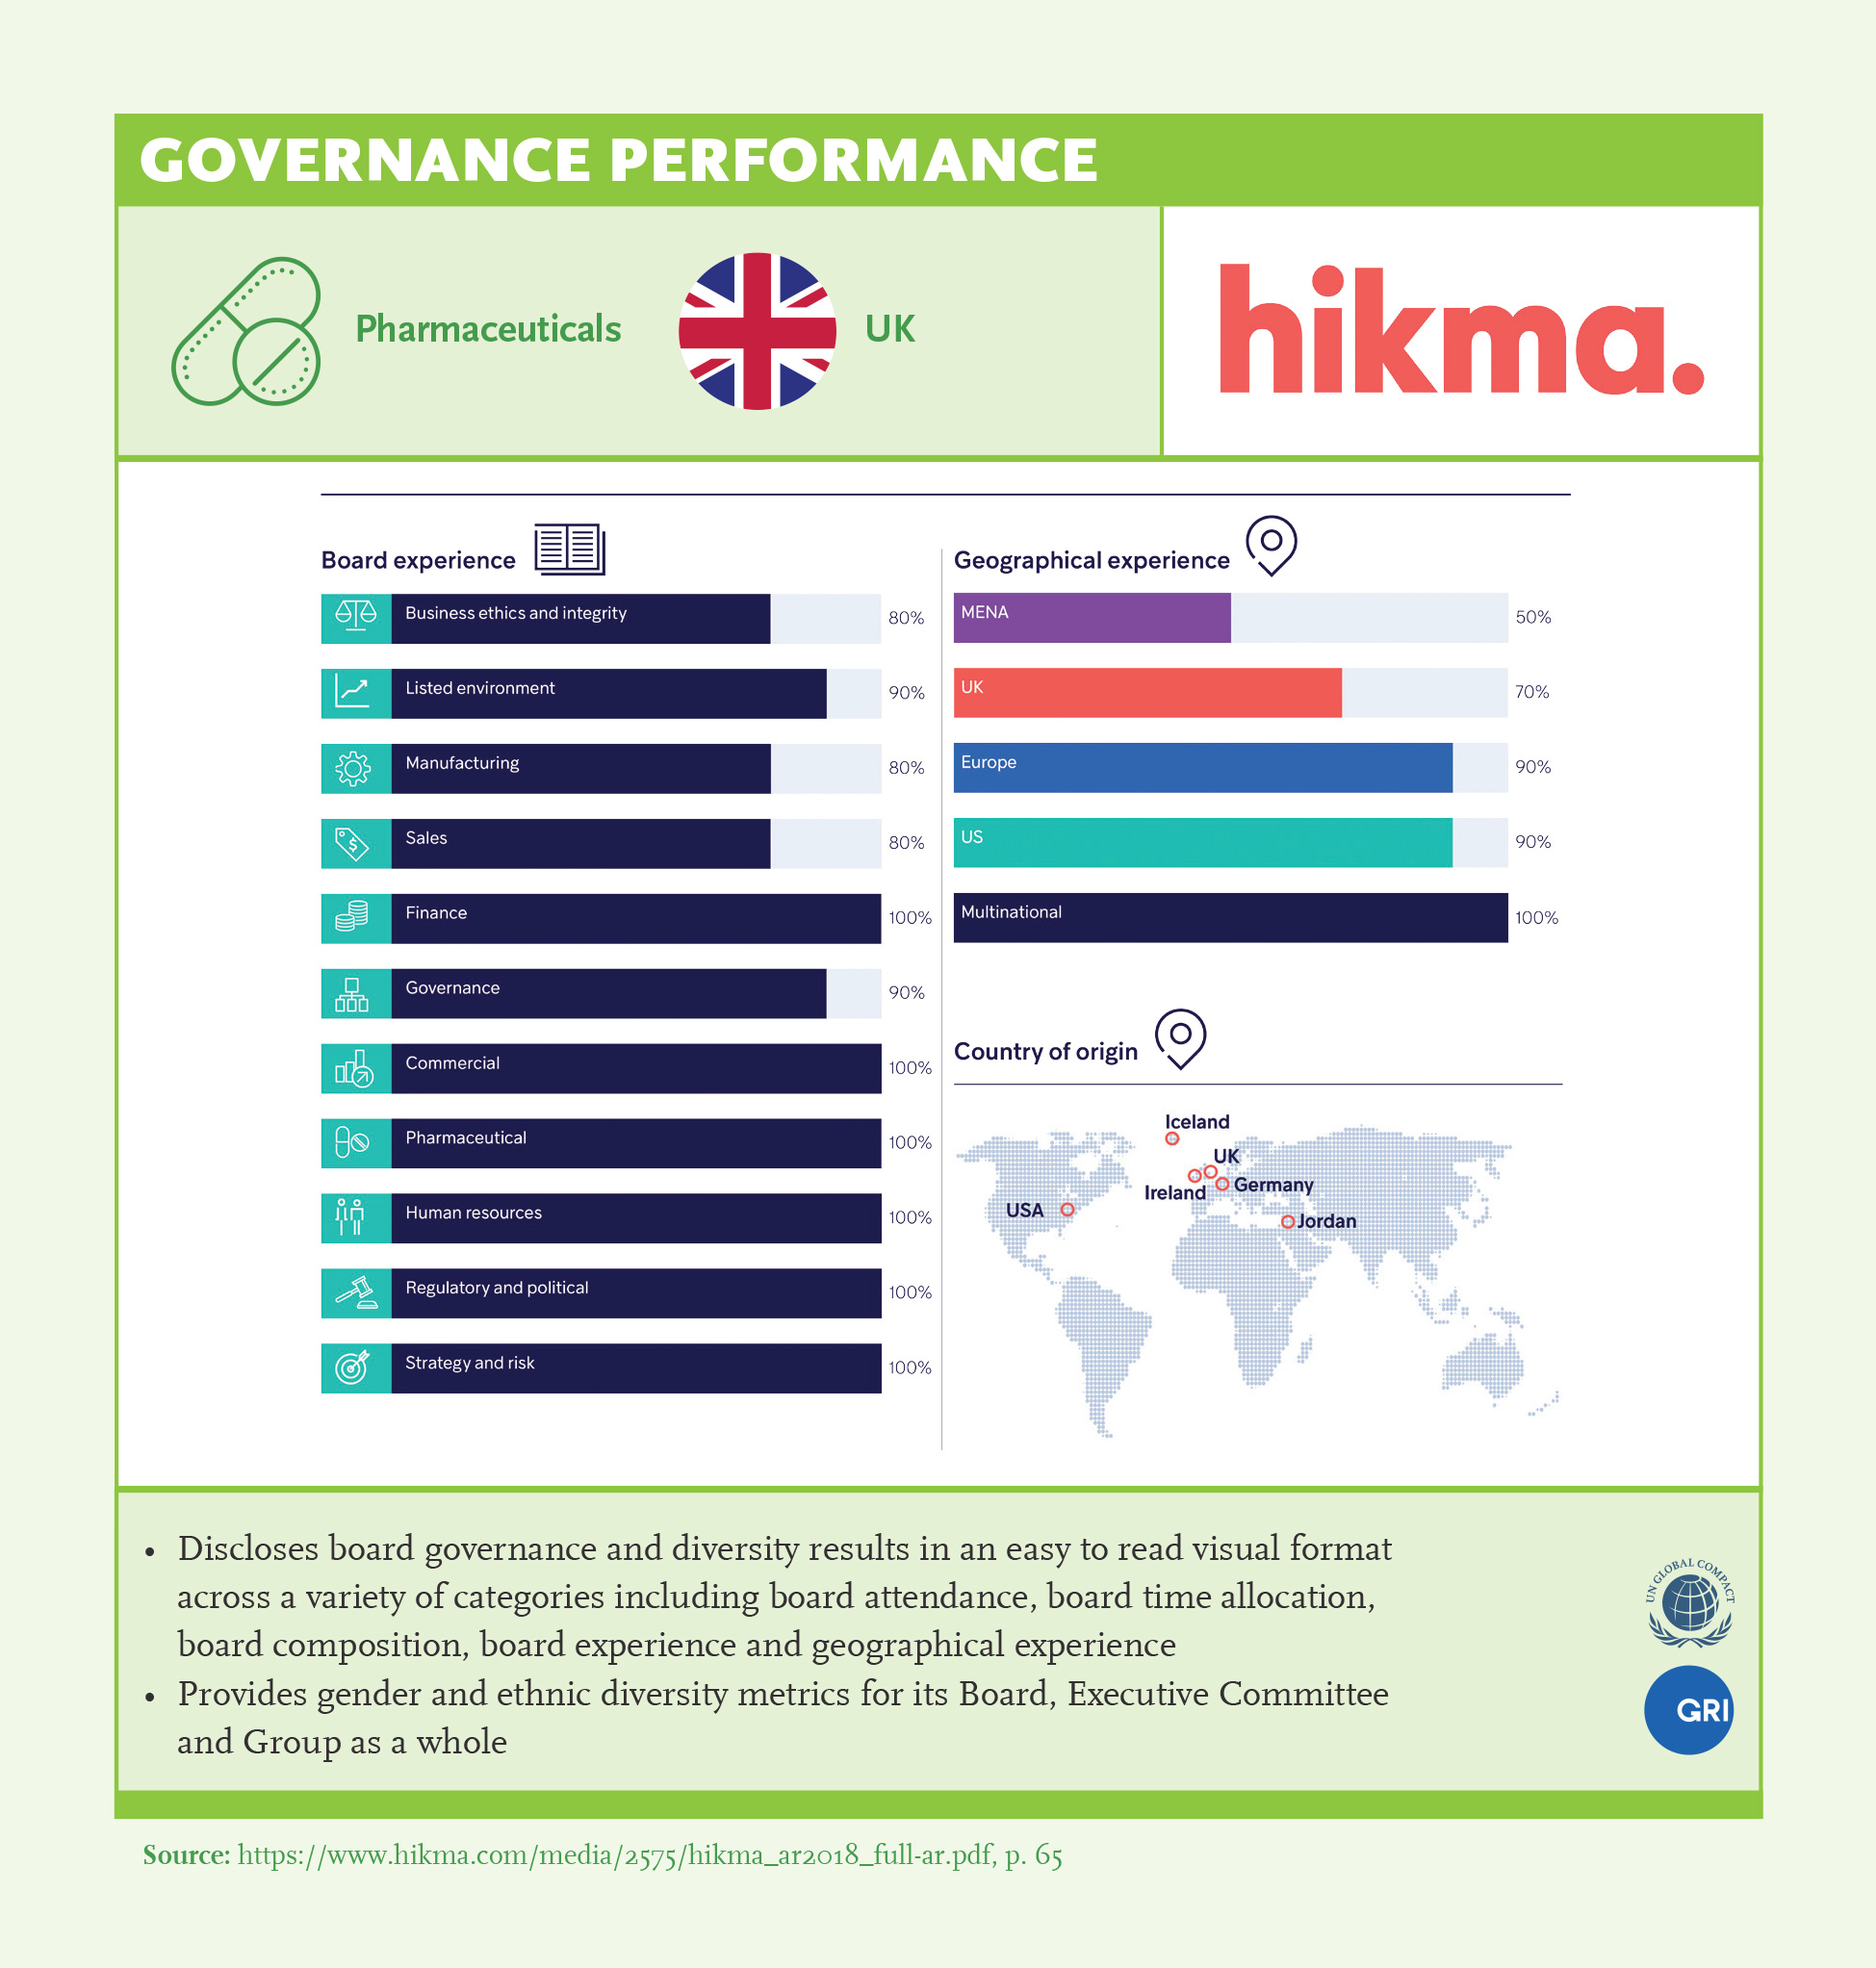
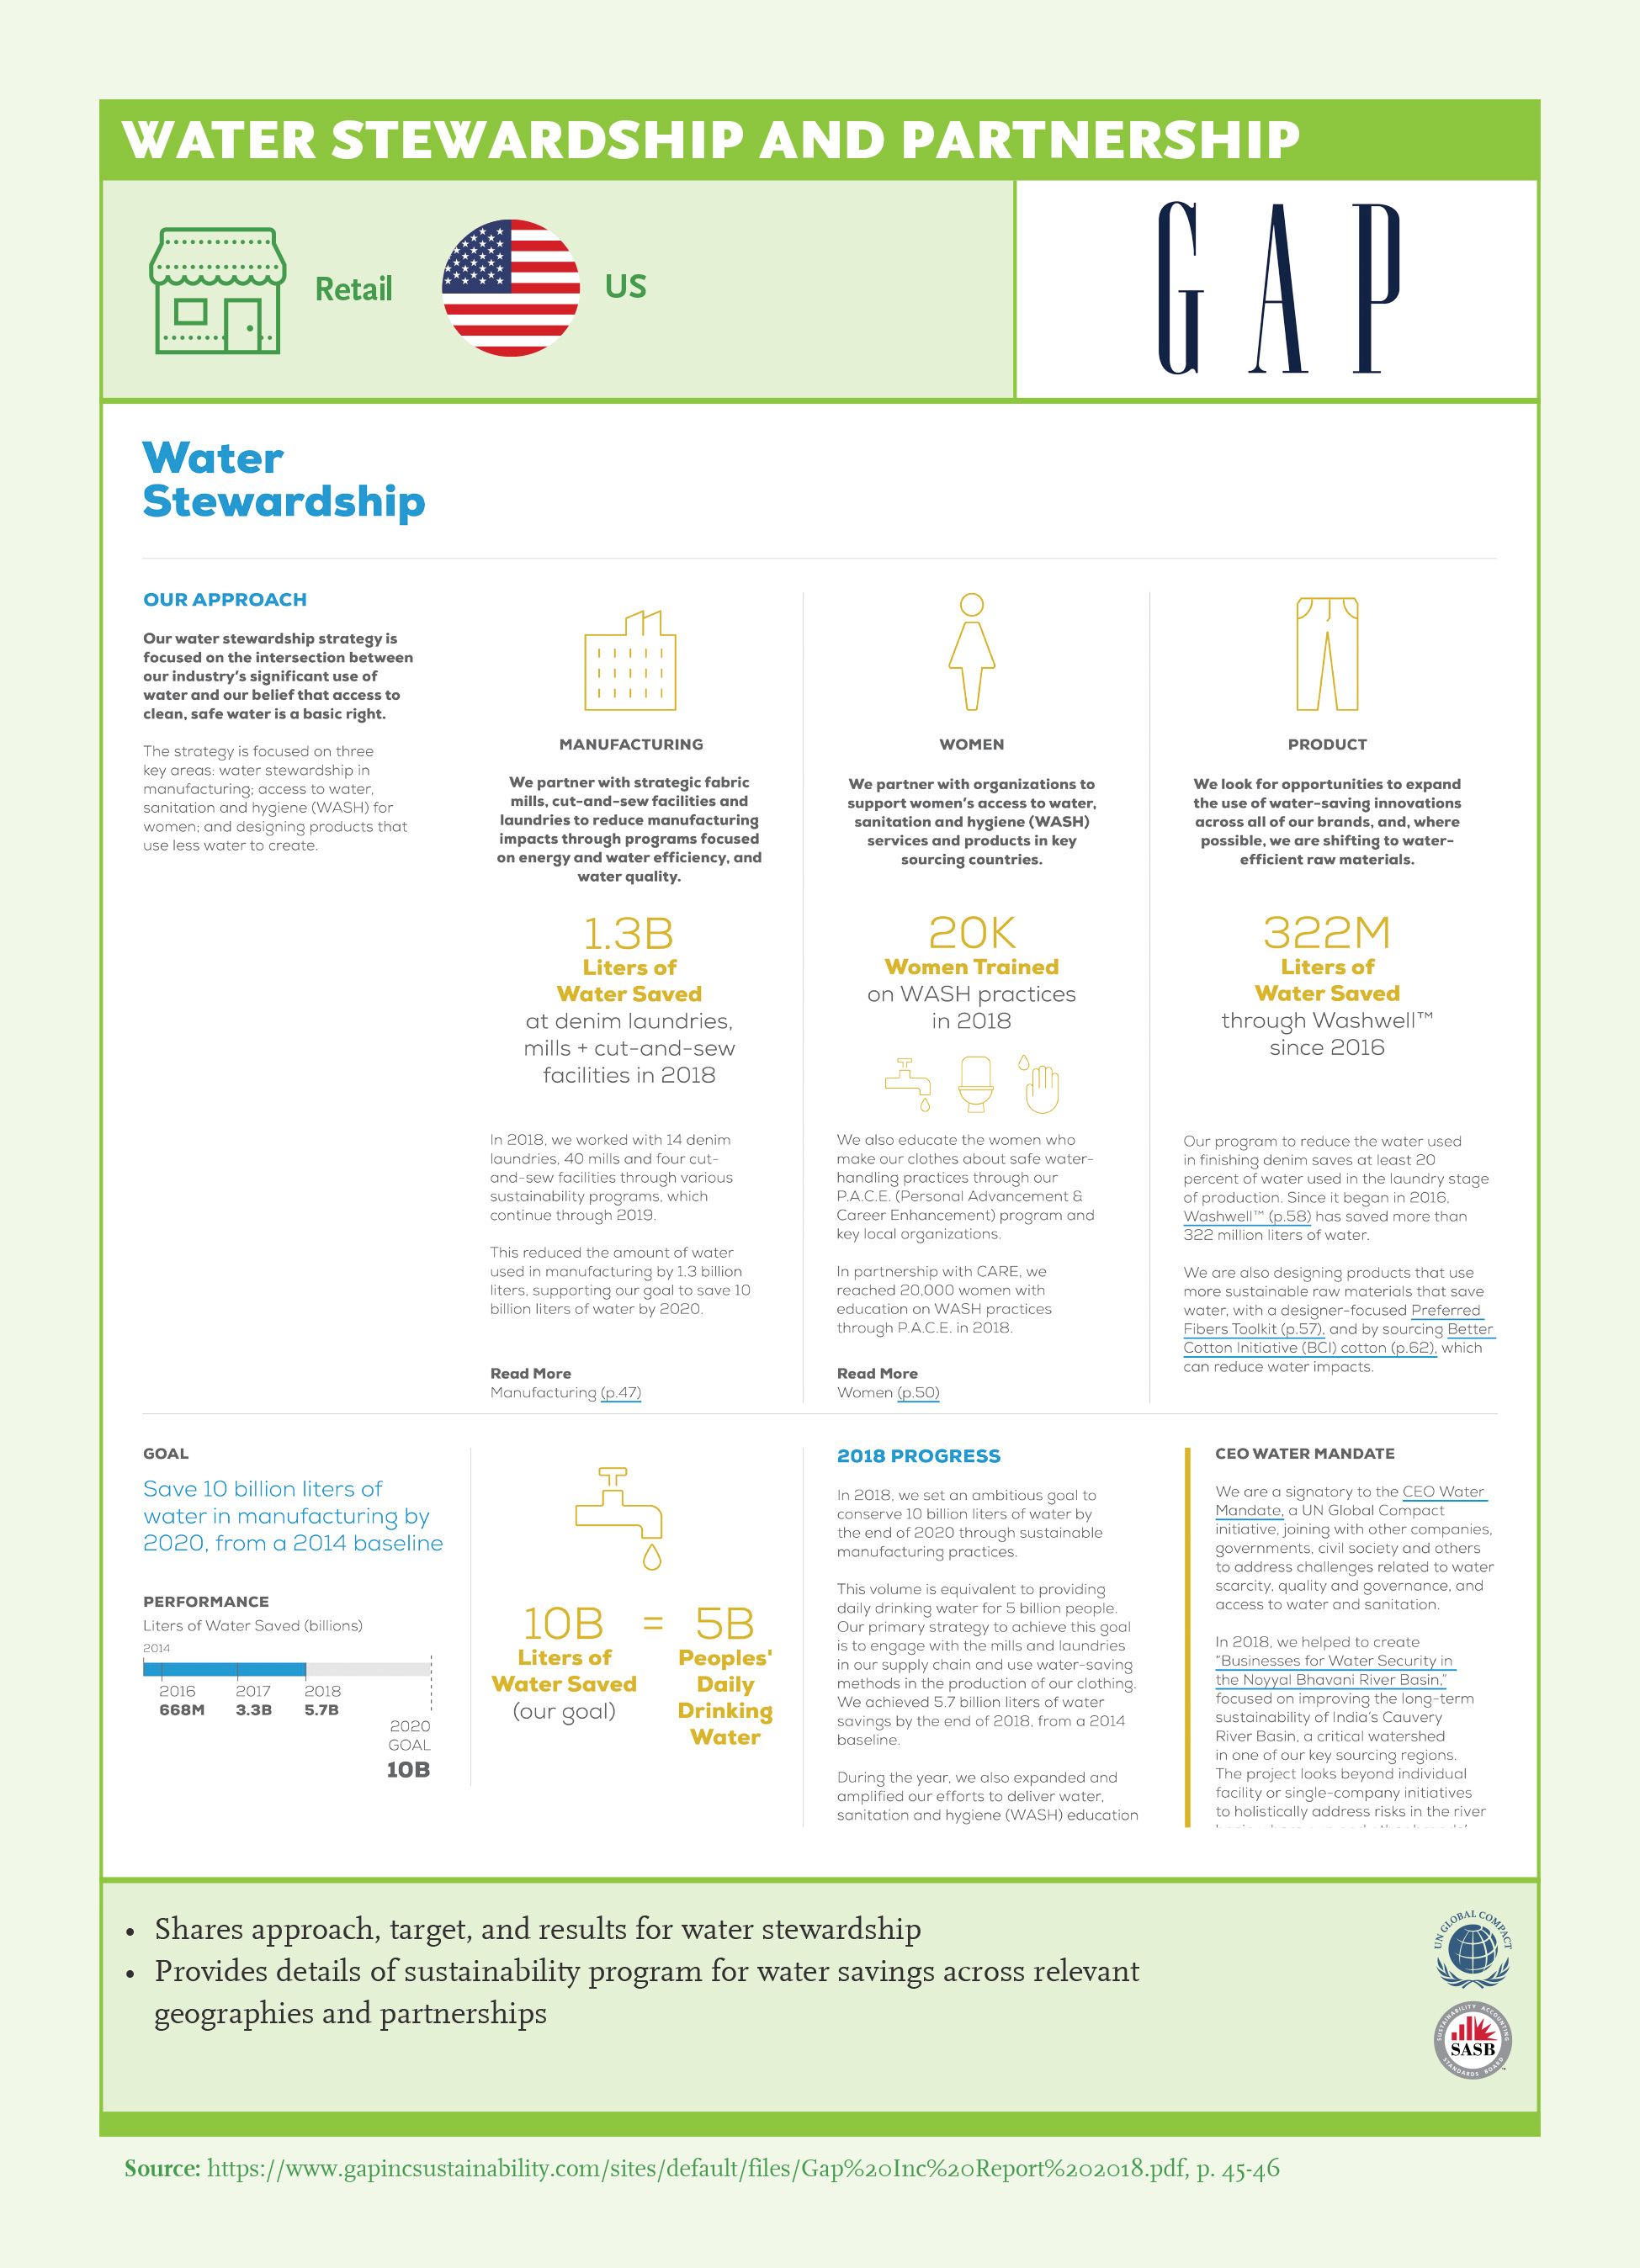
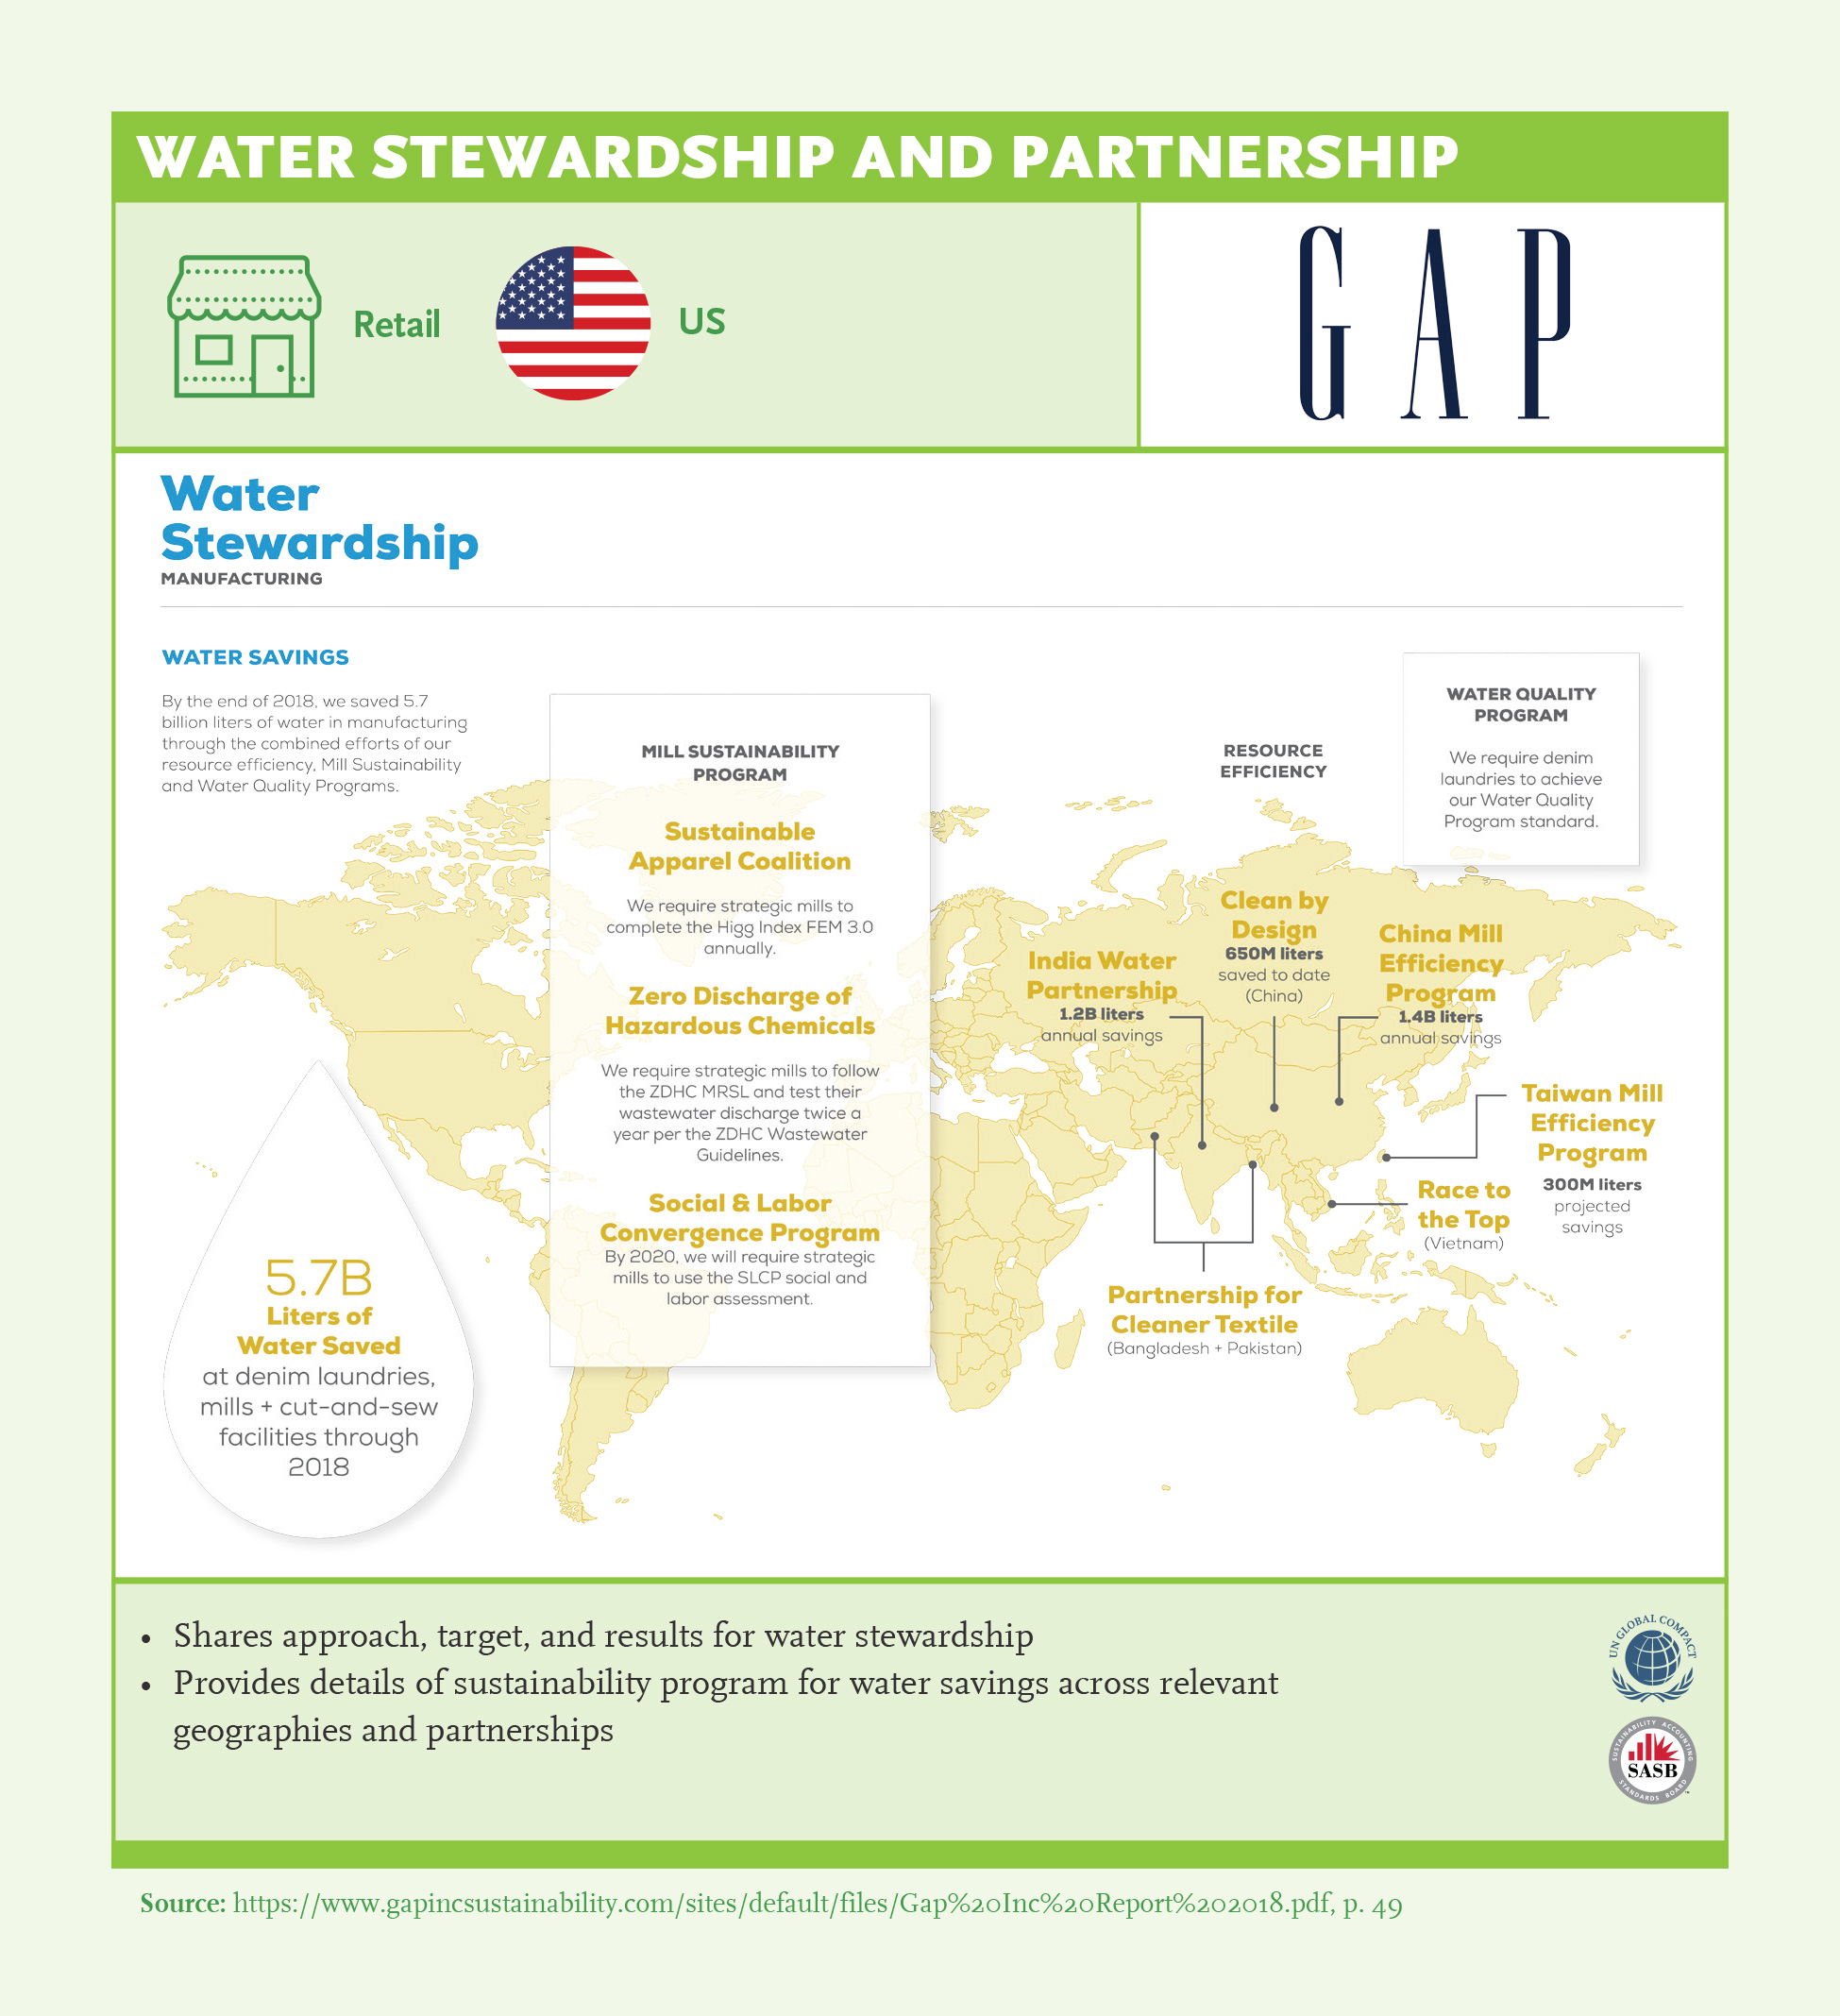
- 2What gets measured, gets improved: Set targets, report results monitor progress on ESG related outcomes. Targets should be relevant, meaningful, measurable, and sufficiently challenging to drive performance. Companies should report past results as well as future targets, to enable investors to assess ESG performance. (Ex: Caterpillar, Gap Inc, Hikma Pharmaceuticals)
- 3Assess results and share remedial action to address gap: Learn from peers, disclose trend/benchmark to improve sustainability performance.
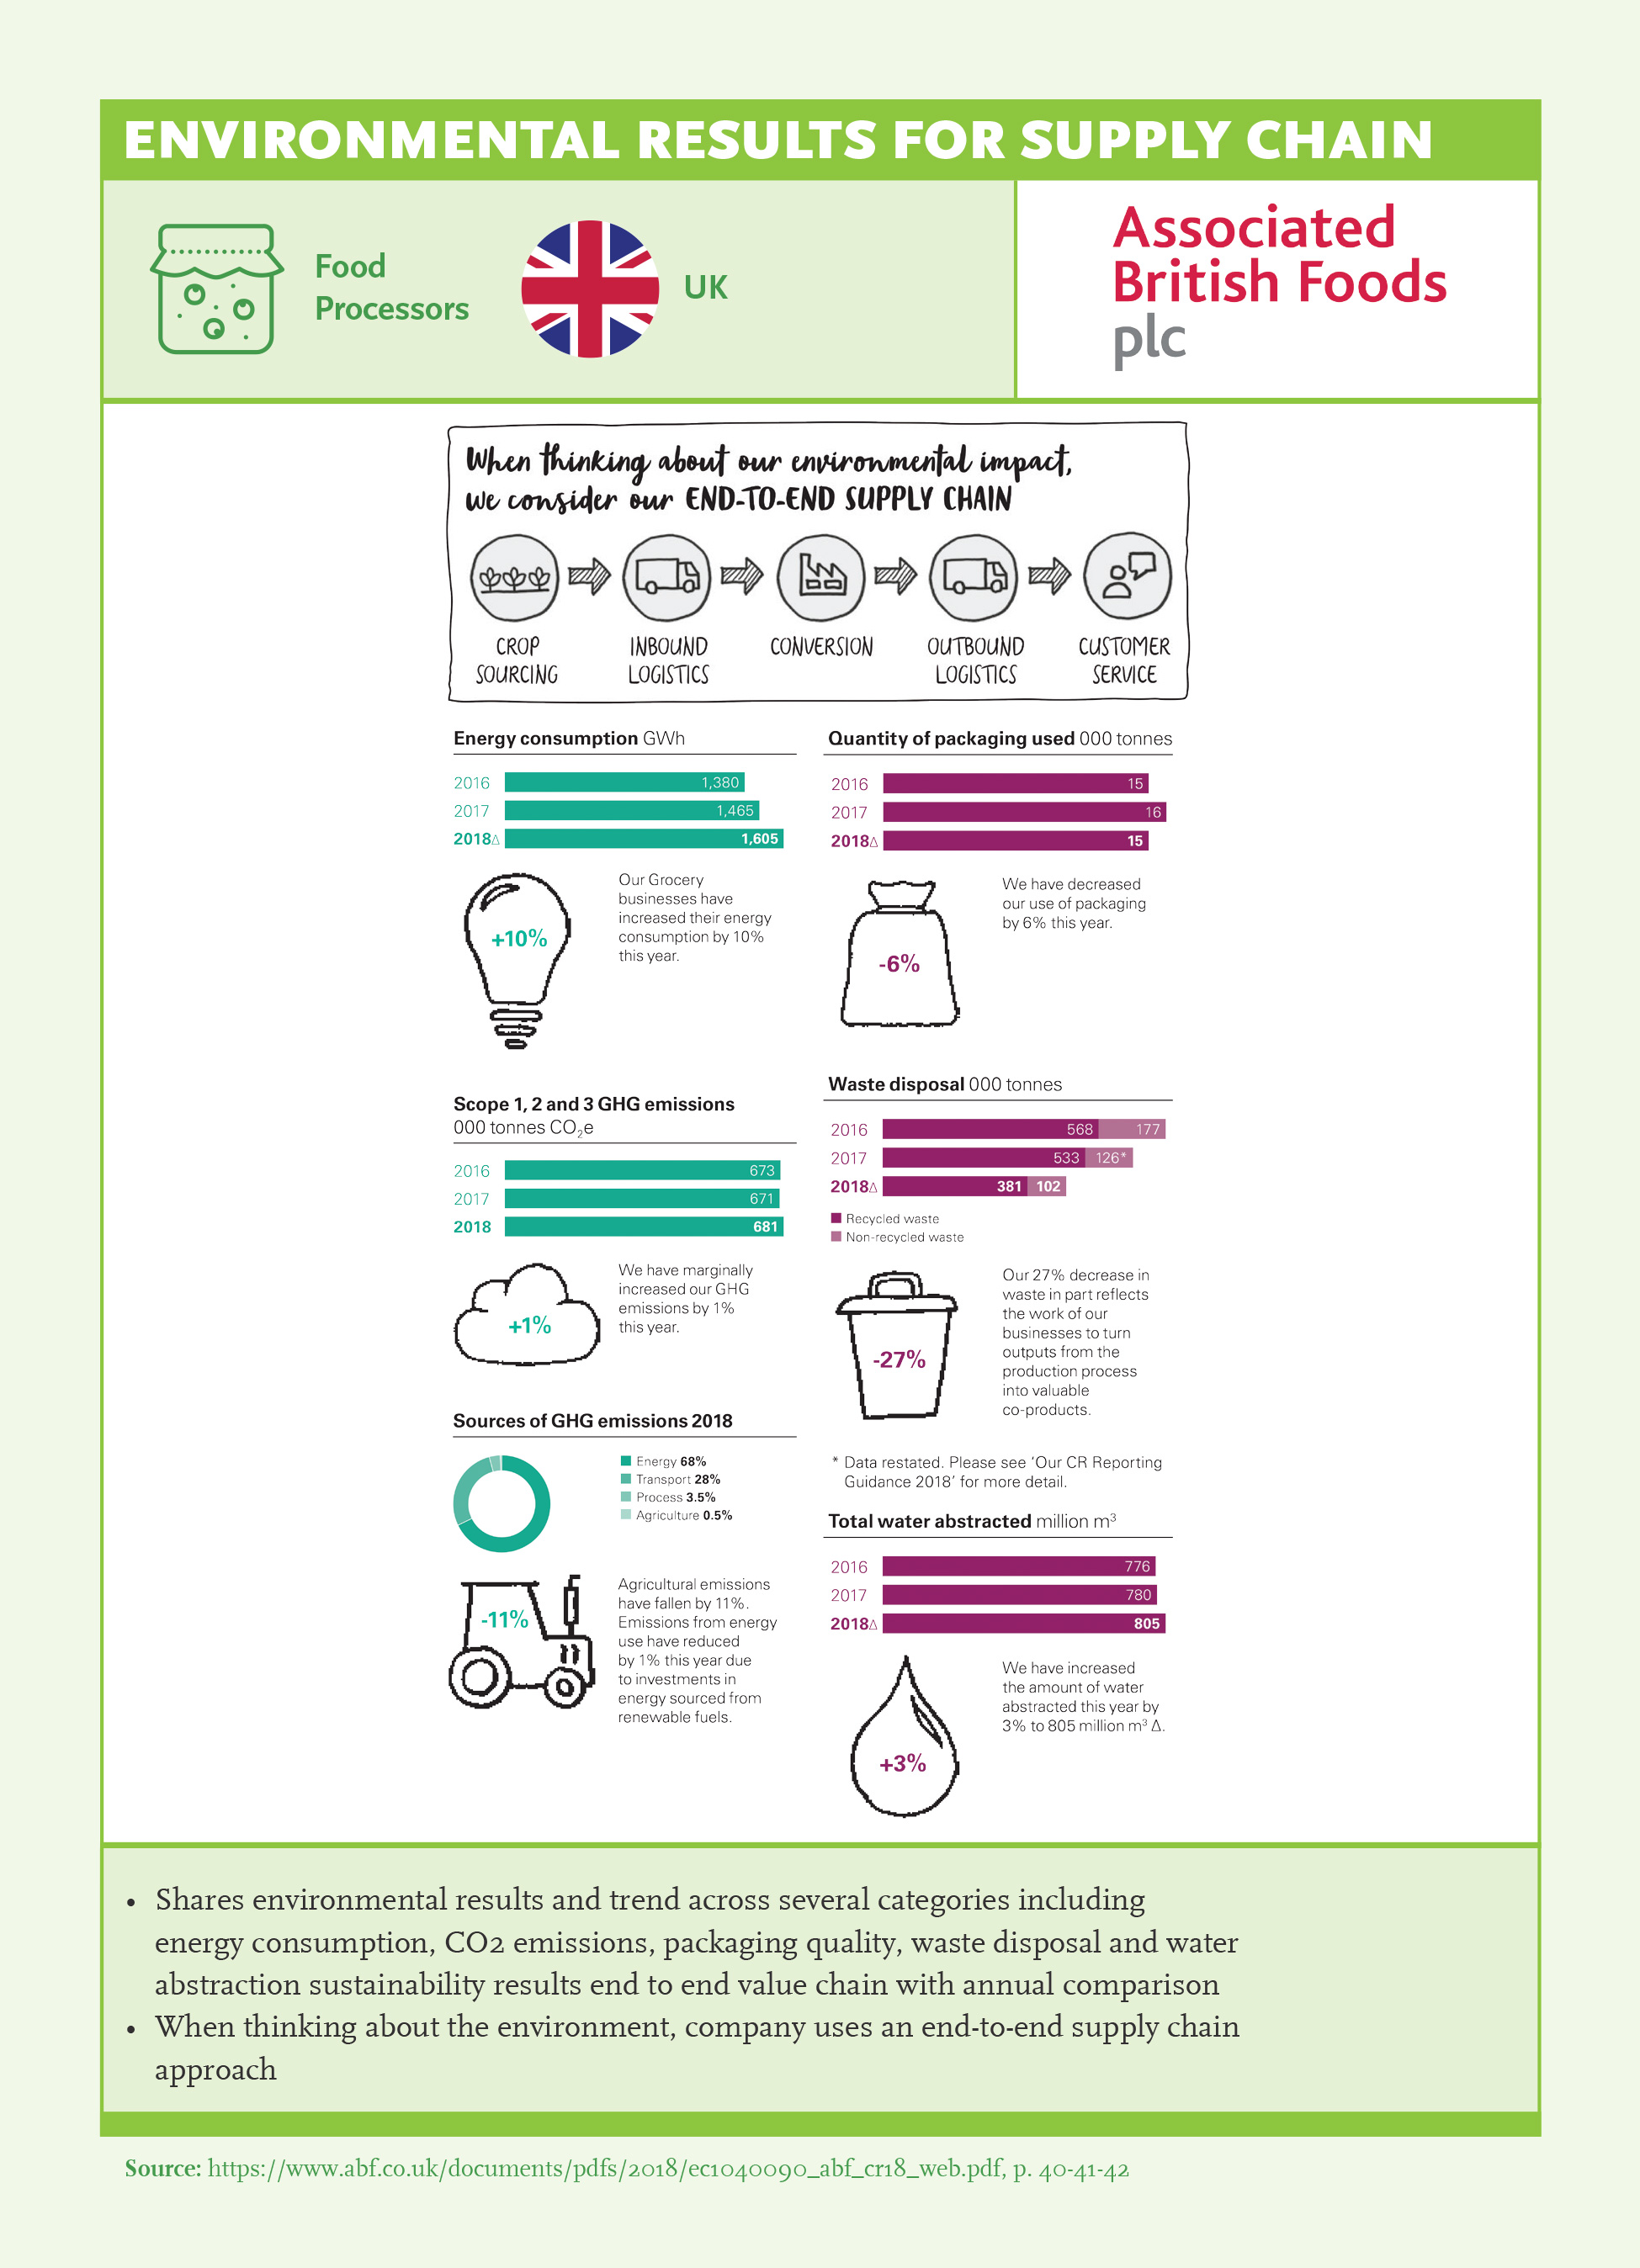
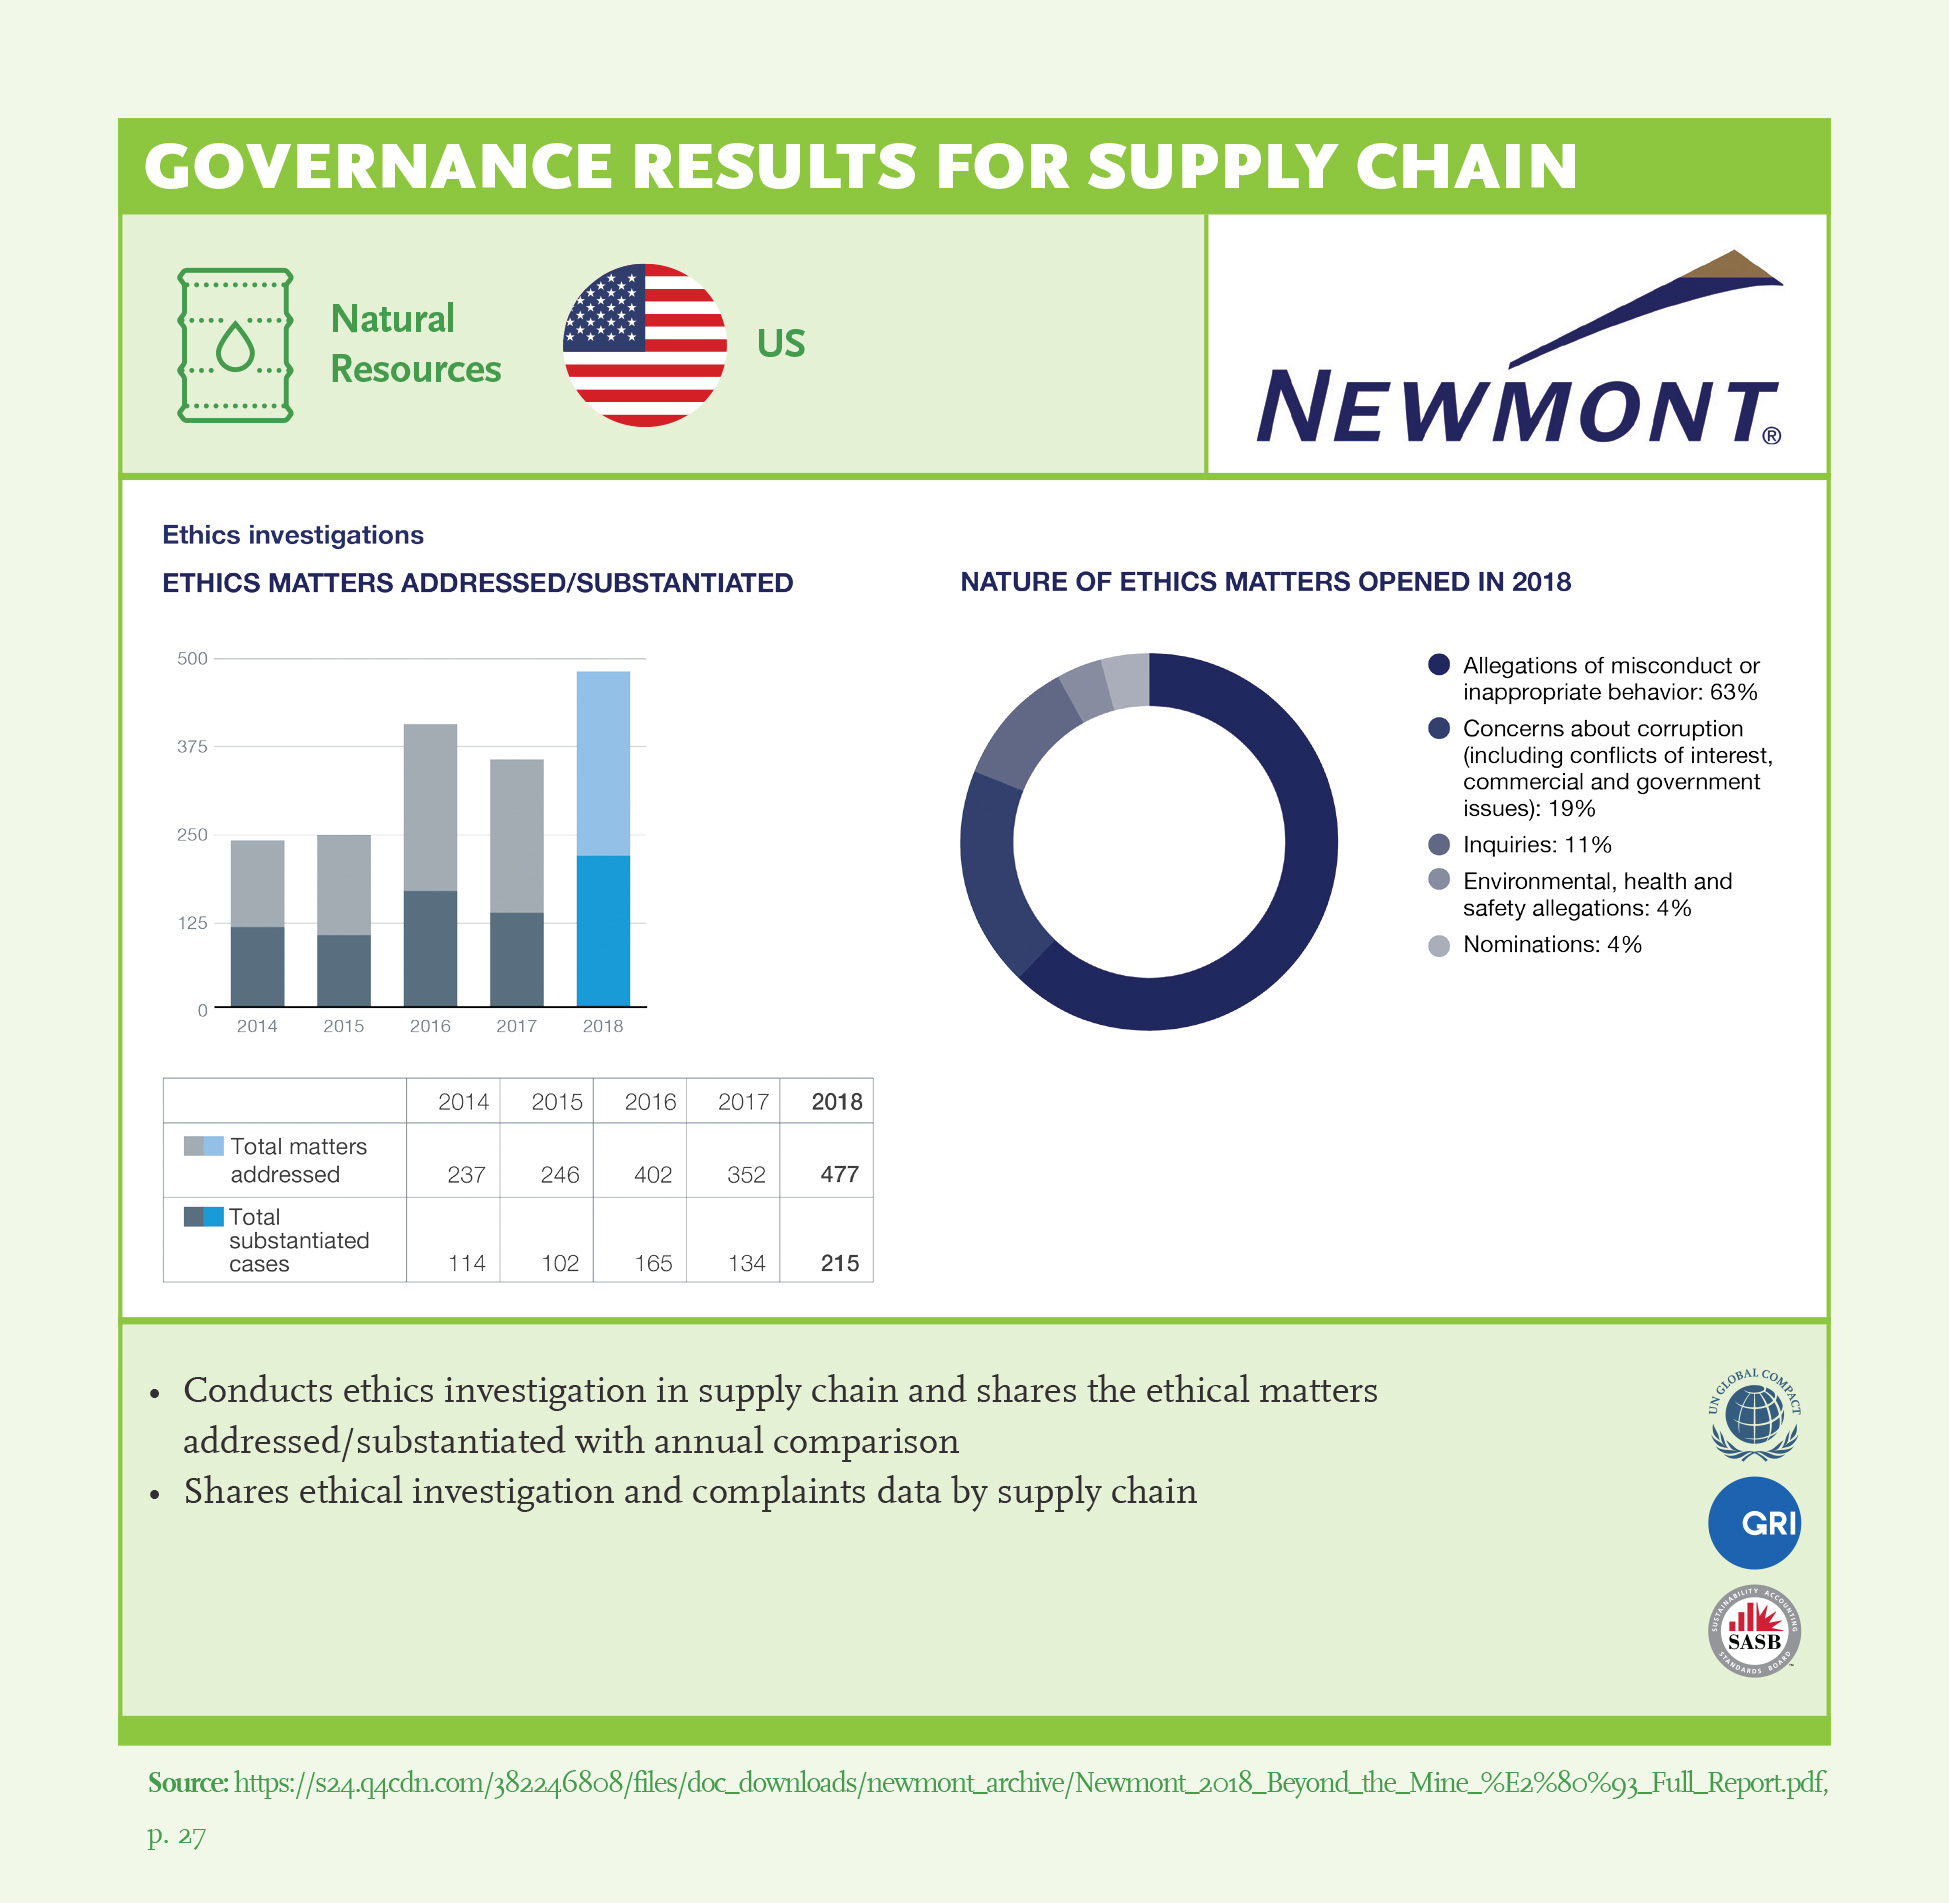
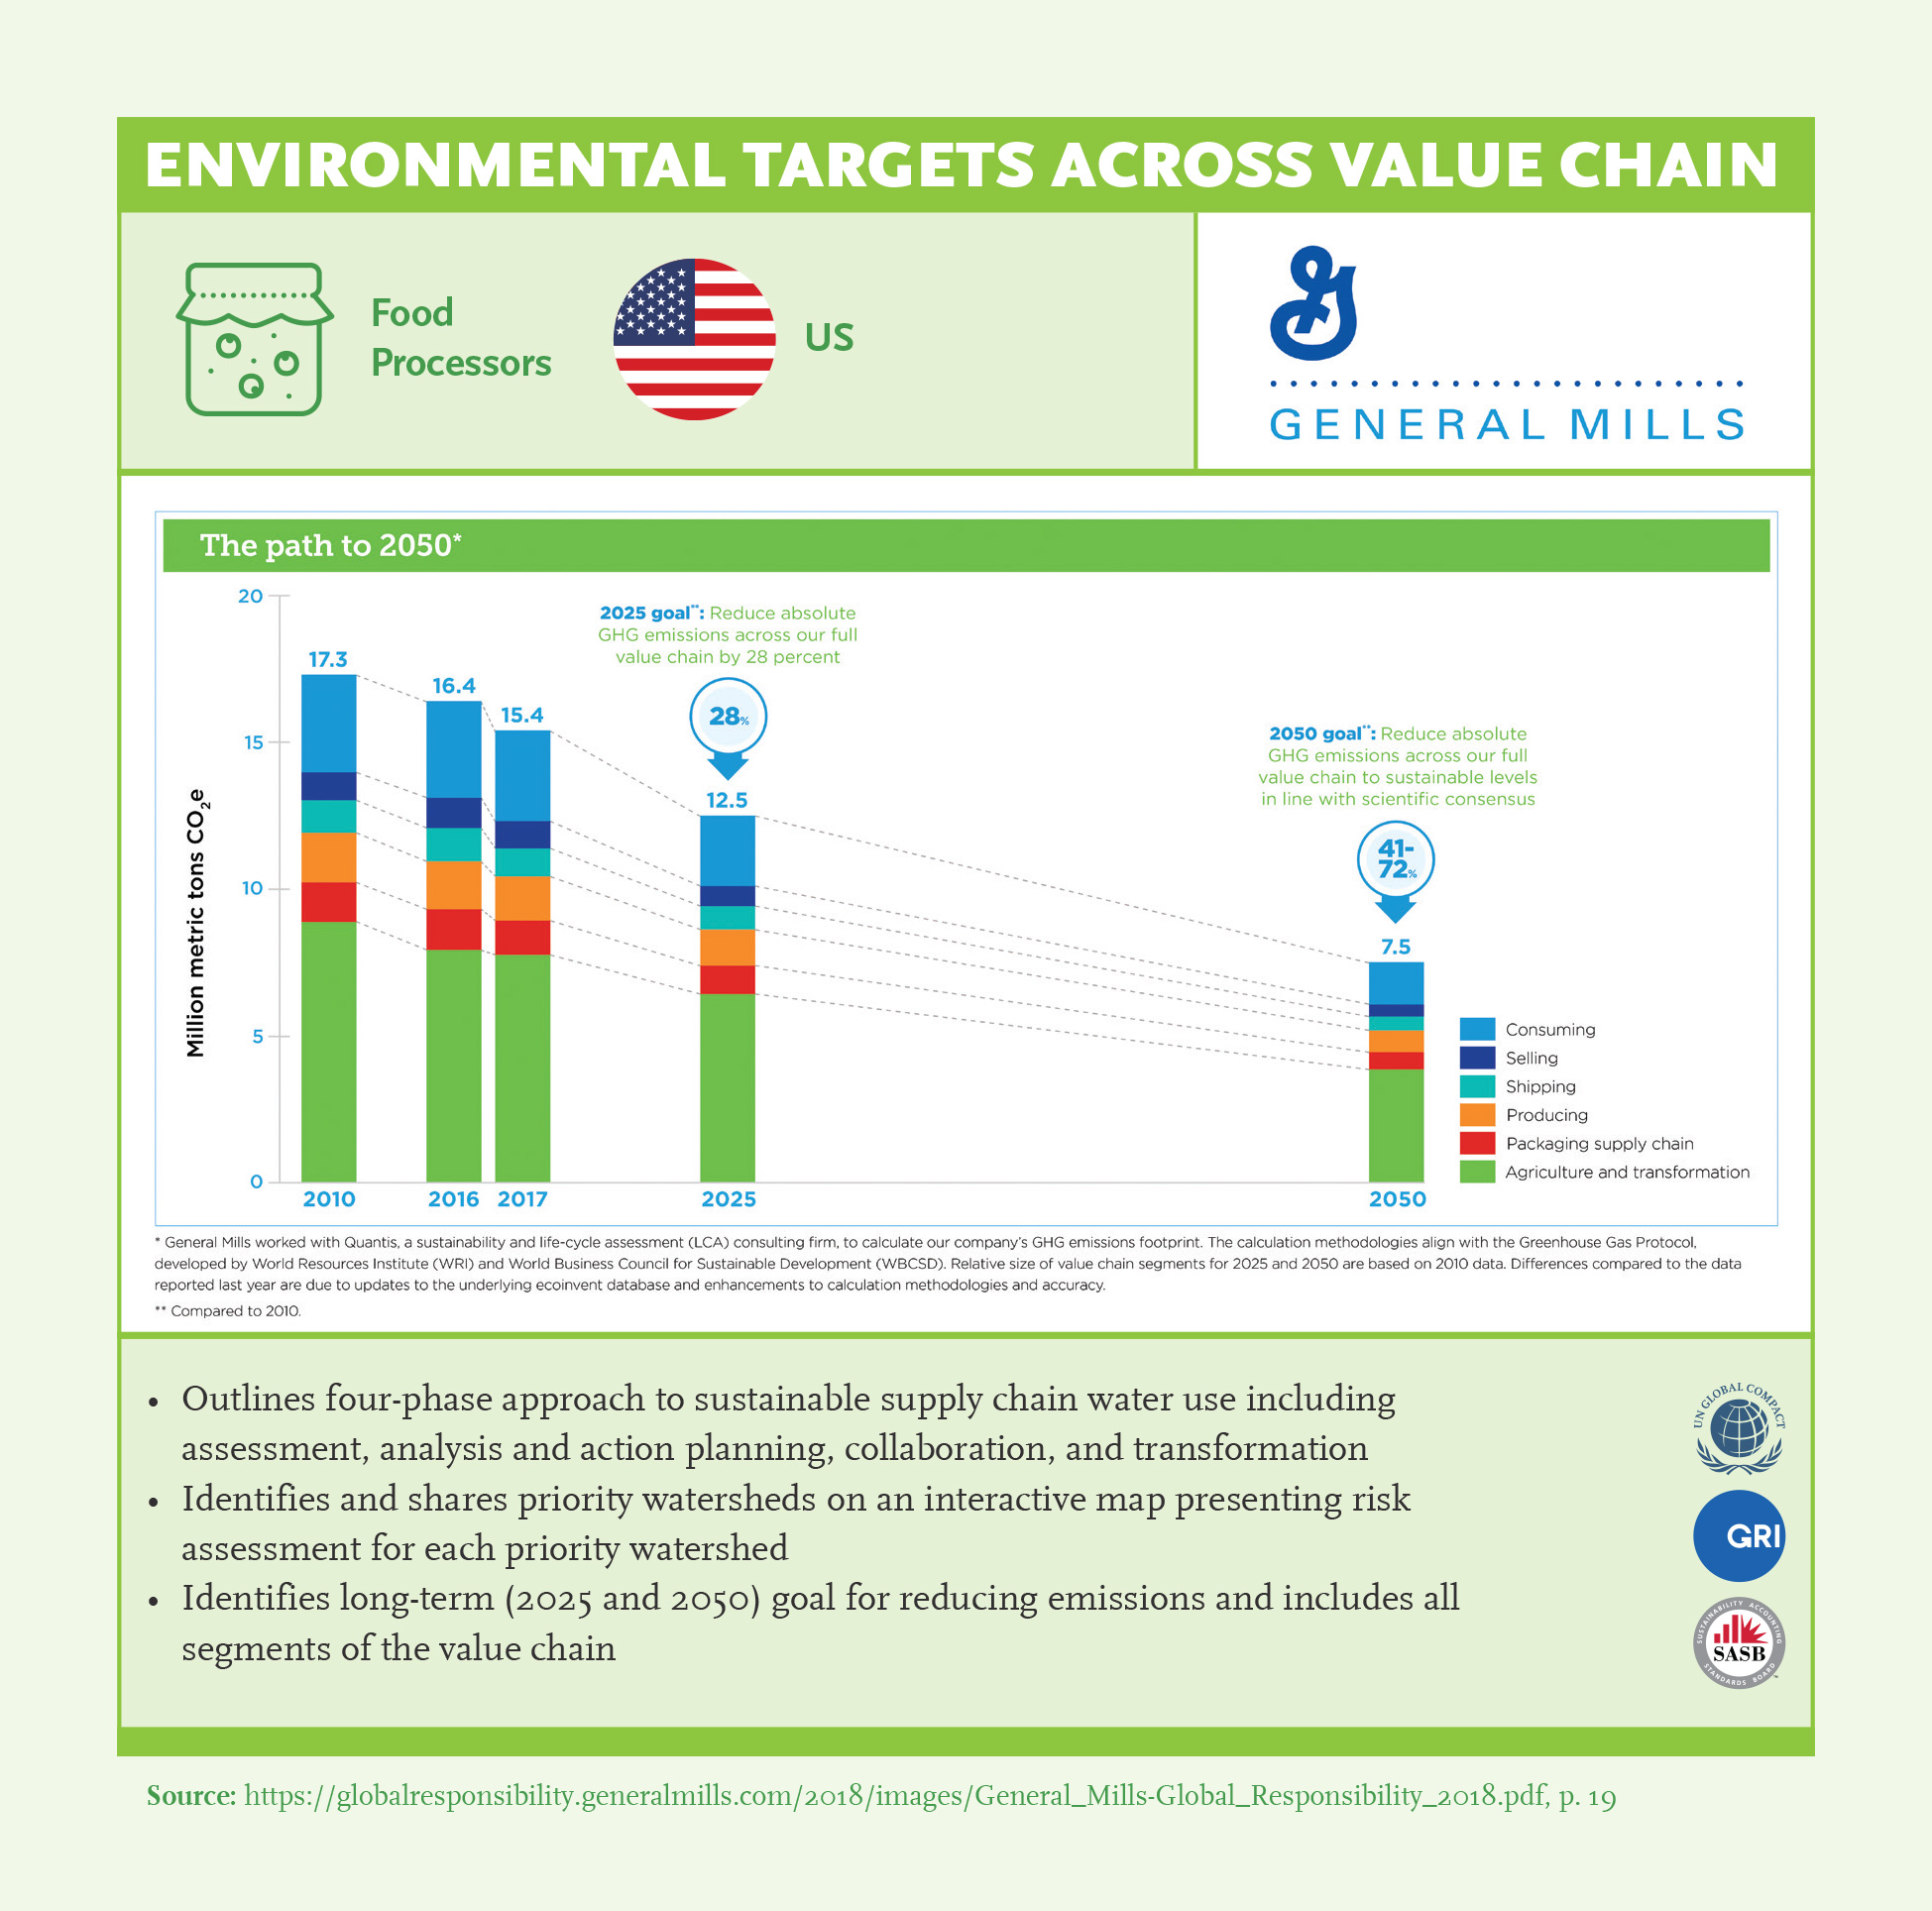
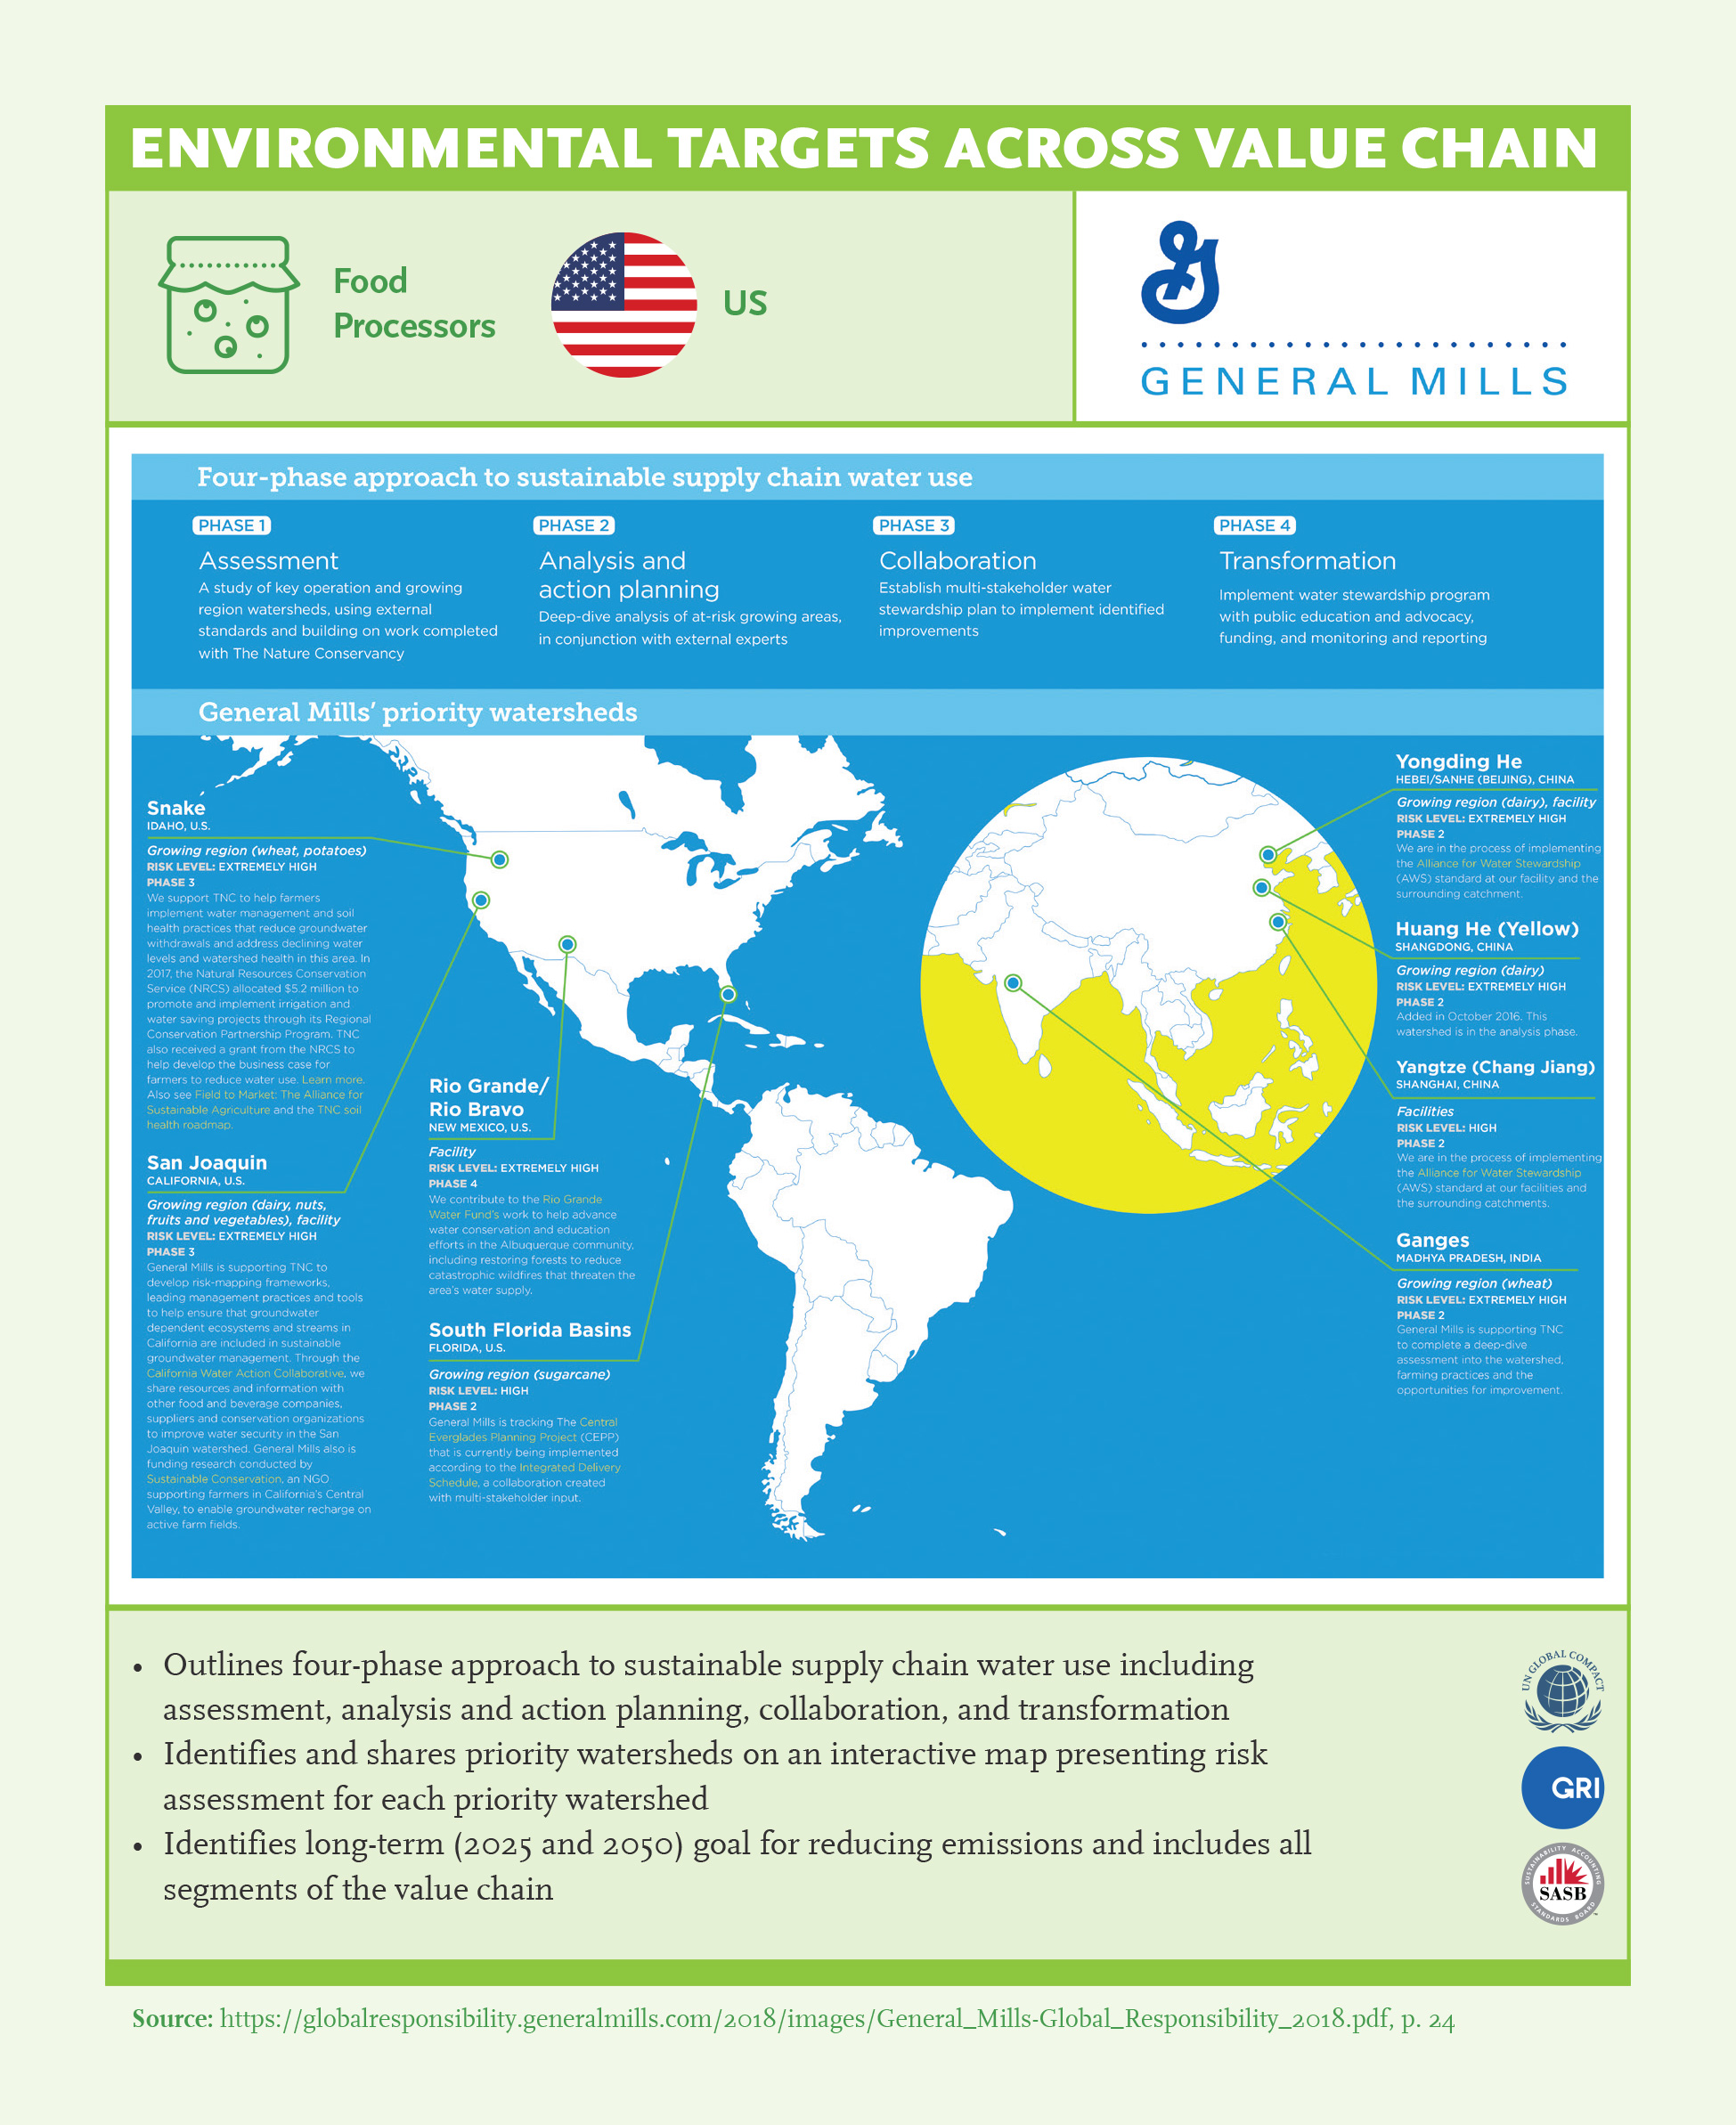
- 4Cover all employees, geographies, and supply chain: Define KPIs, set targets, measure and report results on the supply chain. All stakeholders must be empowered and moving towards the same direction in order to achieve sustainability goals. (Ex: Associated British Foods, Newmont Mining, General Mills)
- 5Manage your company as well as your ecosystem (environment, community, and partnerships): Take responsibility for the environment and the communities in which the company operates. Sustainability can only be achieved through collective action. (Ex: Gap Inc)
- 6Cooperate and partner for impact for a step-change in how we do business.
- 7Develop reliable, consistent set of indicators to measure intangibles (eg: corporate culture, human capital, diversity, and inclusion): Through consistency in reporting standards, data becomes comparable and useful for measuring and comparing performance across different areas. More consistency is required in reporting metrics for biodiversity and hazardous materials (environment), human rights and diversity (social) and compliance metrics incl. anti-corruption and ethics (governance).
- 8Cooperate for the development of a unified reporting framework: Standardization and comparability of sustainability data, methodology and metrics. Investors want financial materiality, consistency (comparability, alignment of standards) and reliability (rigorous audit). Further simplification of reporting frameworks is necessary to enable comparison between company’s performance and ease of understanding so it can be used as input for decision-making. Simplification would also be beneficial in terms of time and cost efficiency.
- 9Pursue sectoral collaboration to define what matters and invest in measurement and reporting systems: For sustainability reporting to be effective, what matters should be defined for different stakeholders and reporting done accordingly. Sectoral partnerships can enhance the clarification of metrics relevant for industry as well as reduce cost in developing methods to measure performance. There should be a push for improvements in consistency in reporting standards, at least within the same industry or clusters, to accelerate adoption of reporting practices by other companies.
- 10Communicate value of metrics and feedback on its usefulness for decision making: Investors should communicate the benefit of information most valuable as useful input for decision-making.
Key Findings
Sustainability Performance
Sustainability performance assessment is based on whether the policies and guidelines are materialized, as well as disclosed performance cover all areas including environment, social and anti-corruption, all operations including emerging markets, all organizational levels, supply chain, and the product life cycle. To assess implementation coverage, we looked for evidence in comprehensive reporting of sustainability performance across key performance indicators.

- Global Sustainability Leaders have successfully integrated policy, KPI’s, and results to include environmental, social and governance issues, however there is room for improvement. As part of our research, we evaluated whether a company sets policy, KPIs and targets and shares results and evaluation of results across specific ESG categories. We find that 85% of companies consistently report on environmental topics, 82% on social topics, and 74% on governance topics.
- Climate Change and Energy are the most consistently reported environmental topics, there is significant room for improvement in consistent reporting in Responsible Sourcing, Hazardous Materials, and Biodiversity.
- The gap between sharing policy and setting targets is high for Water and Waste & Packaging.
- Companies that consistently report on social sustainability performance focus mainly on Health & Safety metrics, almost all companies have a policy and share results for Diversity & Inclusion and Human Rights issues, but there is room for improvement to set targets in these categories.
- There is room for improvement in setting targets and assessing results on governance areas. 65% report consistently on Executive Compensation, 21% for board diversity and only 10% on Compliance (Ethics, Anti-corruption etc.)

Environmental Targets
- More than 90% of companies in Automotive, Chemicals, Consumer Goods, Food Processing, and Machinery and Equipment companies set environmental targets. Lowest for Utilities (60%). +90% companies in all countries share environmental targets, except for India and China.
- All Consumer Goods and Food Processor companies in our sample set environmental targets, coverage and depth in reporting environmental targets (90%+ in more than 5 areas).
- Climate Change: Highest for Chemicals and Food Processors, >90% for climate change in Germany, South Africa, Türkiye and UK - China (64%) and India (70%) lagging behind (regulators) - Lower in IR (86%) vs other standards (+90%).
- Energy: Highest for Food Processors, Consumer Goods and Chemical, medium across all sectors and countries. Highest for Türkiye and Germany, UNGC companies outperform.
- Water: 88% in Consumer goods, >80% for Food Processors and Chemicals, Water highest for Germany and Türkiye and UK, very low for China.
- Waste & Packaging led by Türkiye (83%).
- Hazardous Materials, Biodiversity and Responsible Sourcing low across all countries, highest for UK (44%, 67% and 63% respectively).
- Responsible Sourcing high for Consumer Goods and Food Processors, higher for UNGC and SASB vs other standards.
- Hazardous materials low for all sectors, highest in Consumer Goods and India companies.

Social Targets
- 90% for Consumer Goods, Food Processors and Telco, lowest for M&E, Pharma and Automotive, highest for UNGC.
- Highest for Health and Safety (92%) – Highest for Türkiye.
- Diversity & Inclusion 67%, highest for Retail and Telco, but not consistently high in any sector (>50%) – 38% in Pharma.
- Human Rights & Labor Practices highest for UNGC – lowest across social categories.
- Product Design & Portfolio – Highest for Germany.
Governance Targets
- Highest room for improvement in governance targets, driven by regulation and varies mostly by country. IR and SASB highest for governance targets.
- Executive compensation sharing >90% in US, UK, and South Africa, not available in India, China, and Türkiye. Room for improvement in Consumer Goods, M&E, and Automotive.
- Target for compliance lowest across all countries, highest for UK And South Africa. Highest for IR among standards.
Coverage Across Value Chain
Managing sustainability requires a company to assume responsibility to manage the impact of all its activities, including its supply chain and the full product portfolio throughout the lifecycle of its products. Hence boards need to focus not only on the sustainability issues arising from the company’s own operations but also on minimizing the impacts throughout its value chain and throughout the lifecycle of its full product portfolio.

- Almost all GSL share ESG results and most set targets across ESG (89%, 85%, 84%).
- However, only half of these companies set targets and share results for their supply chain.
Sustainability Stewardship
Taking a reactive approach to sustainability is not sufficient. Companies should move from focusing on short-term profits to long-term impact and from a shareholder-centric to stakeholder-centric view. This requires not only managing the negative and positive sustainability impacts of the company’s operations but also taking responsibility for the company’s wider sphere of influence. There are a few companies taking the lead towards a proactive-approach to sustainability and assuming leadership for their ecosystems, which requires a complete overhaul of traditional performance models. However, exampels of this are not yet widespread even among the GSLs.
Managing your ecosystem includes taking responsibility for the environment, communities and networks in which the company operates. Environmental stewardship can include protecting watersheds or biodiversity to ensure the continuity of natural resources for future generations. Social stewardship can include investing in communities and positively infuencing stakeholders in the ecosystem in which the company operates through awareness and behavioral change campaigns and trainings. For governance, the concept of stewardship would require assuming responsibility for improving the business climate. Ecosystem responsibility requires pursuing non-traditional partnerships between public, private and social spheres, or between competitors within the same industry to accelerate impact towards Sustainable Development Goals.

- Consumer goods, Food Processors and Natural Resources lead in sharing targets for ecosystem, communities, and partnerships, but there is significant room for improvement for managing the wider sphere of influence, especially for the environment (38%).
- Consumer Goods, Telecommunication, and Food Processors have the highest share of targets for community (85%, 85%, 79% respectively).
- Food Processors, Consumer Goods, Natural Resources have the highest share of targets for partnerships (83%, 69%, 63% respectively).
Best Practice Examples
Link to SDGs
The Sustainable Development Goals (SDGs) define global sustainable development priorities and aspirations for 2030 and seek to mobilize global efforts around a common set of goals and targets. In 2015, SDGs were approved by almost 200 countries as a common framework on how to focus their actions for a sustainable future. In 2019, world leaders convened to take stock of SDG progress and Secretary General emphasized the need to close the action- intention gap. Looking forward to 2030 – it is clear that corporations should take leadership and mobilize stakeholders if we are to reach the SDG targets for 2030.
Awareness about the importance of changing behaviors for a sustainable future as well as commitment to action is definitely increasing. However, there is need to act fast and scale up progress. SDGs can be utilized as a tool to connect business strategies with global priorities. SDGs have significant impact on the environment and social structure in which business will operate in the future. The SDGs present an opportunity for business-led solutions and technologies to be developed and implemented to minimize negative impacts and maximize positive impacts on people and the planet.
SDGs have significant impact on the environment and social structure in which business will operate in the future. Business can serve as role- models to spark collective action towards environmental sustainability, social development, and good governance. The complexity of the nature of SDGs require mobilizing resources to scale-up impact. The global nature of problems requires non-traditional partnership across corporate, non-governmental and public spheres as well as among competitors within the same industry to share the costs of initial investments and increase effectiveness of execution. (scale-up and innovation for transformational change).
Recommendations
- 1Link with strategy and prioritize: Companies must shift to a proactive, forward-looking approach to encompassing SDGs.
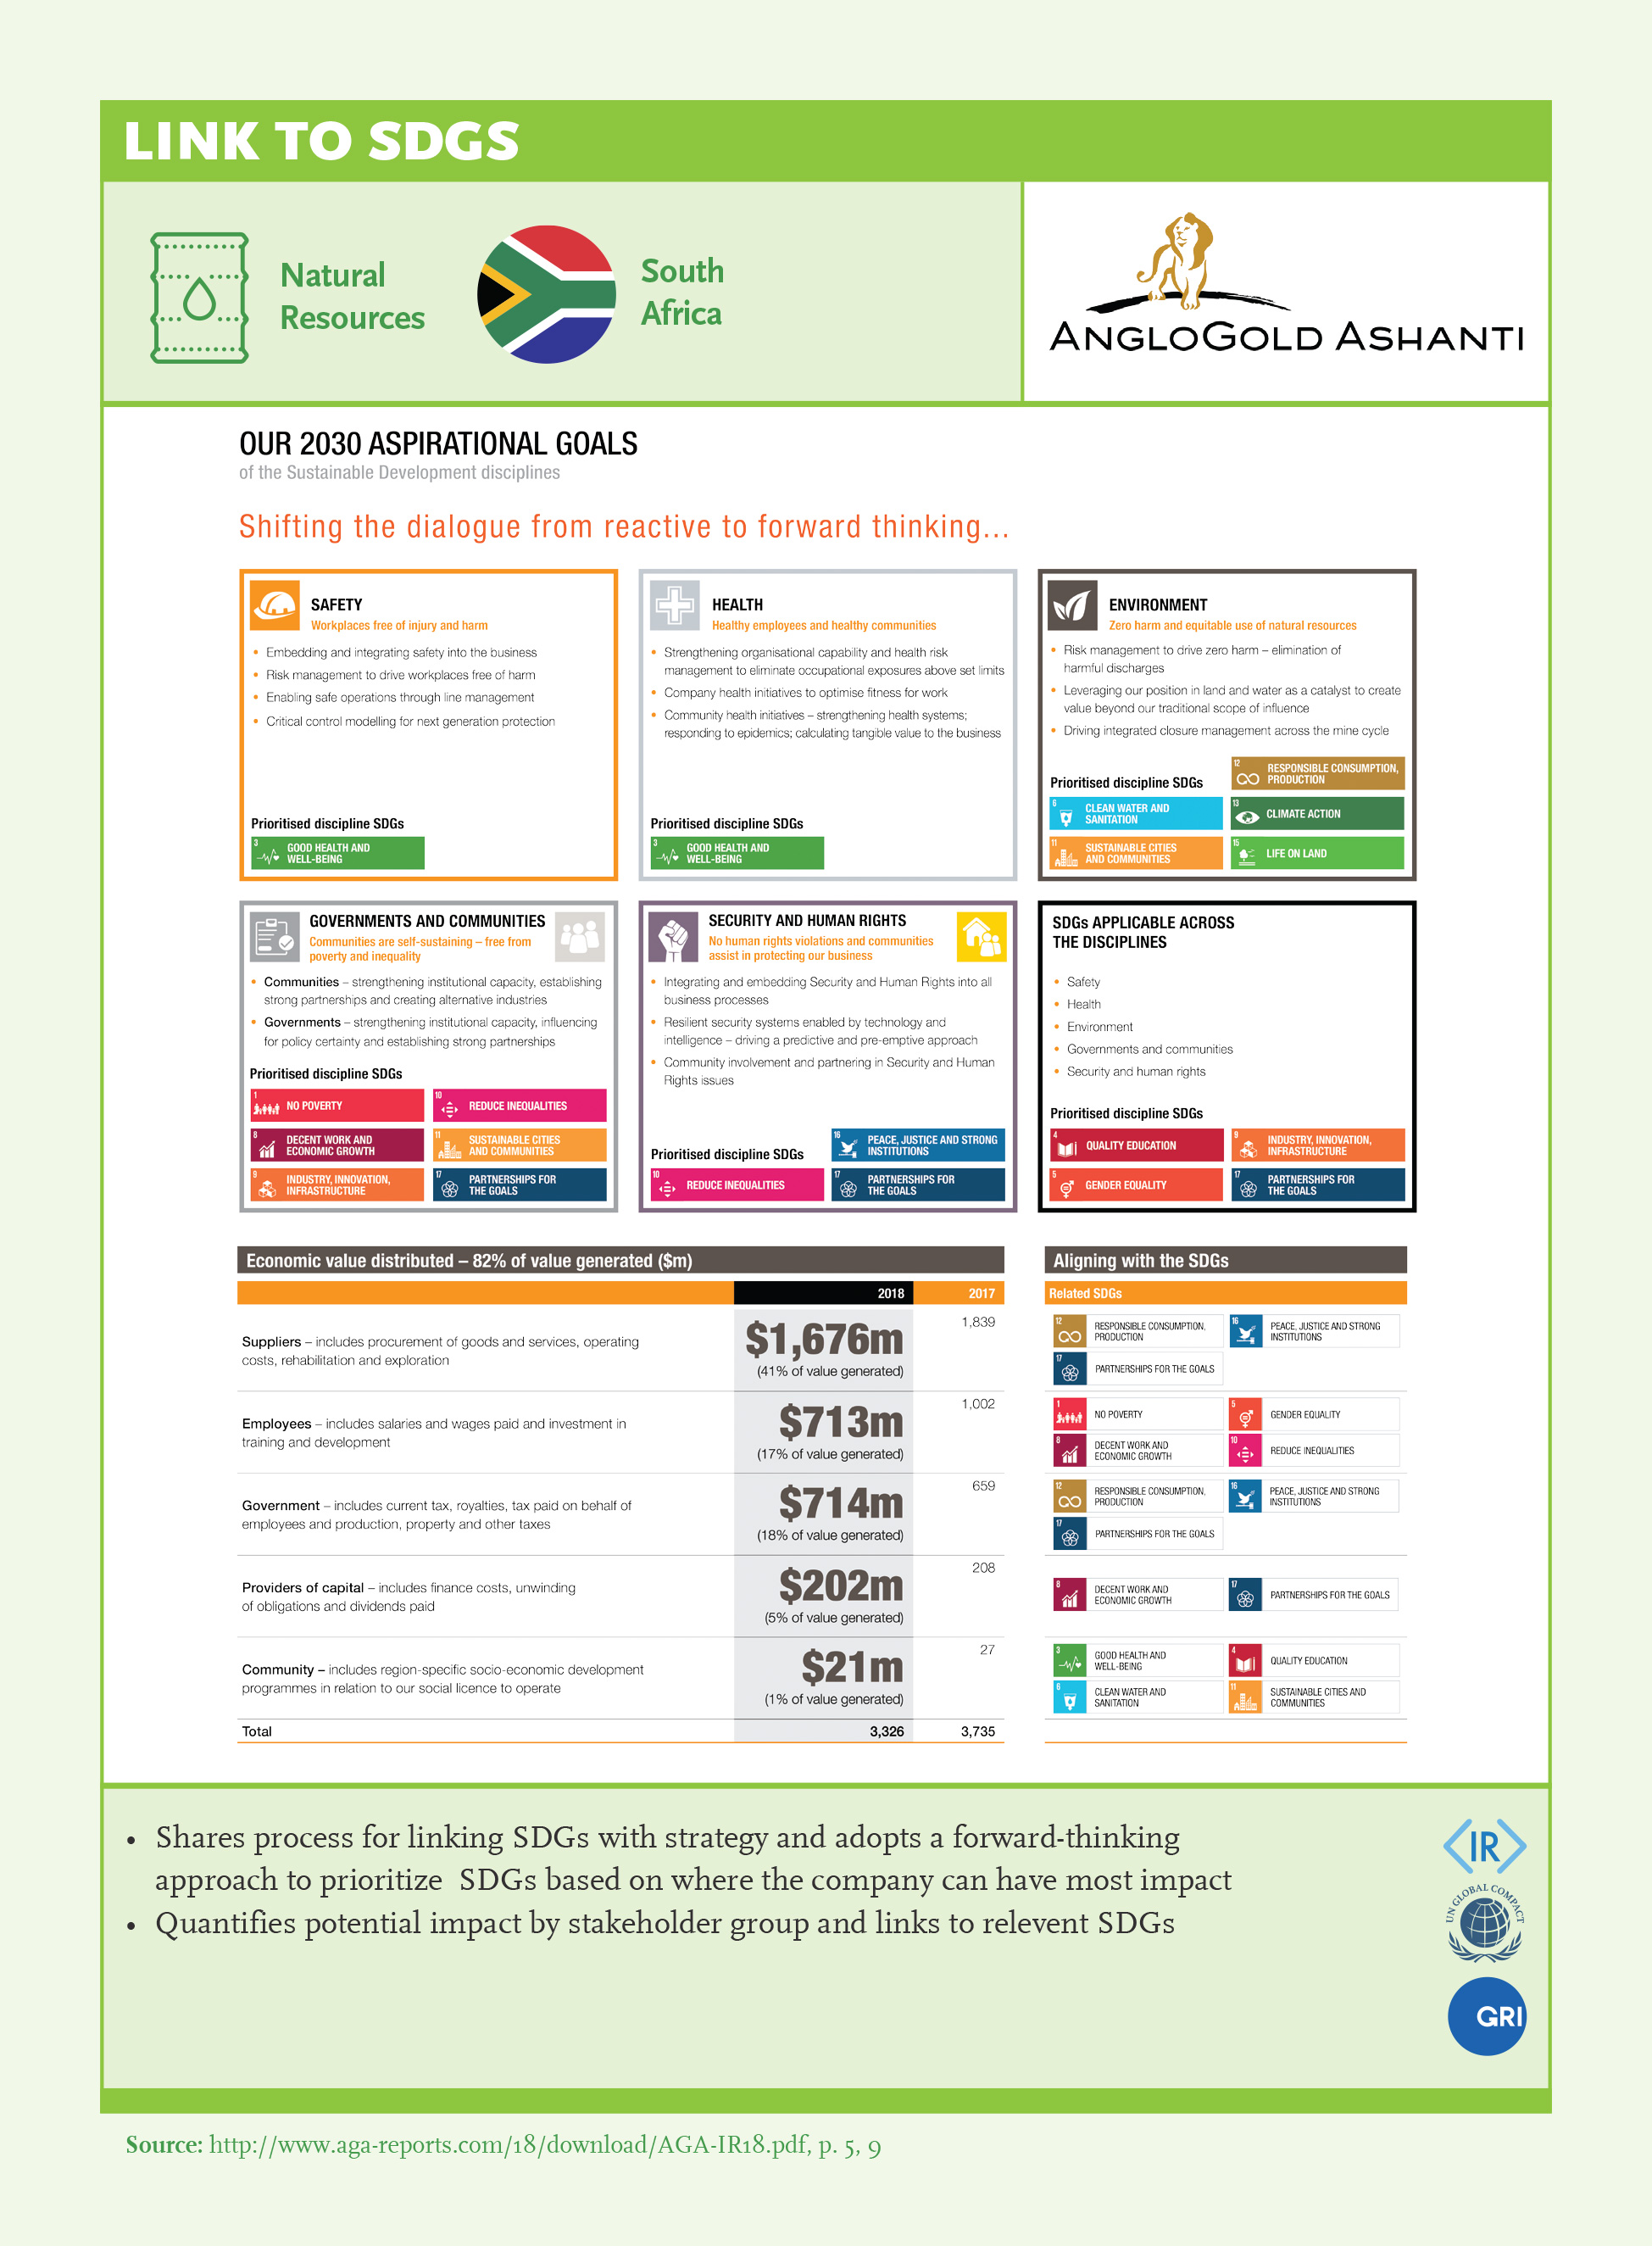
- 2Quantify your contribution for stakeholders: Link their priority SDGs with relevant stakeholder groups and quantify their impact. (Ex: Anglogold Ashanti)
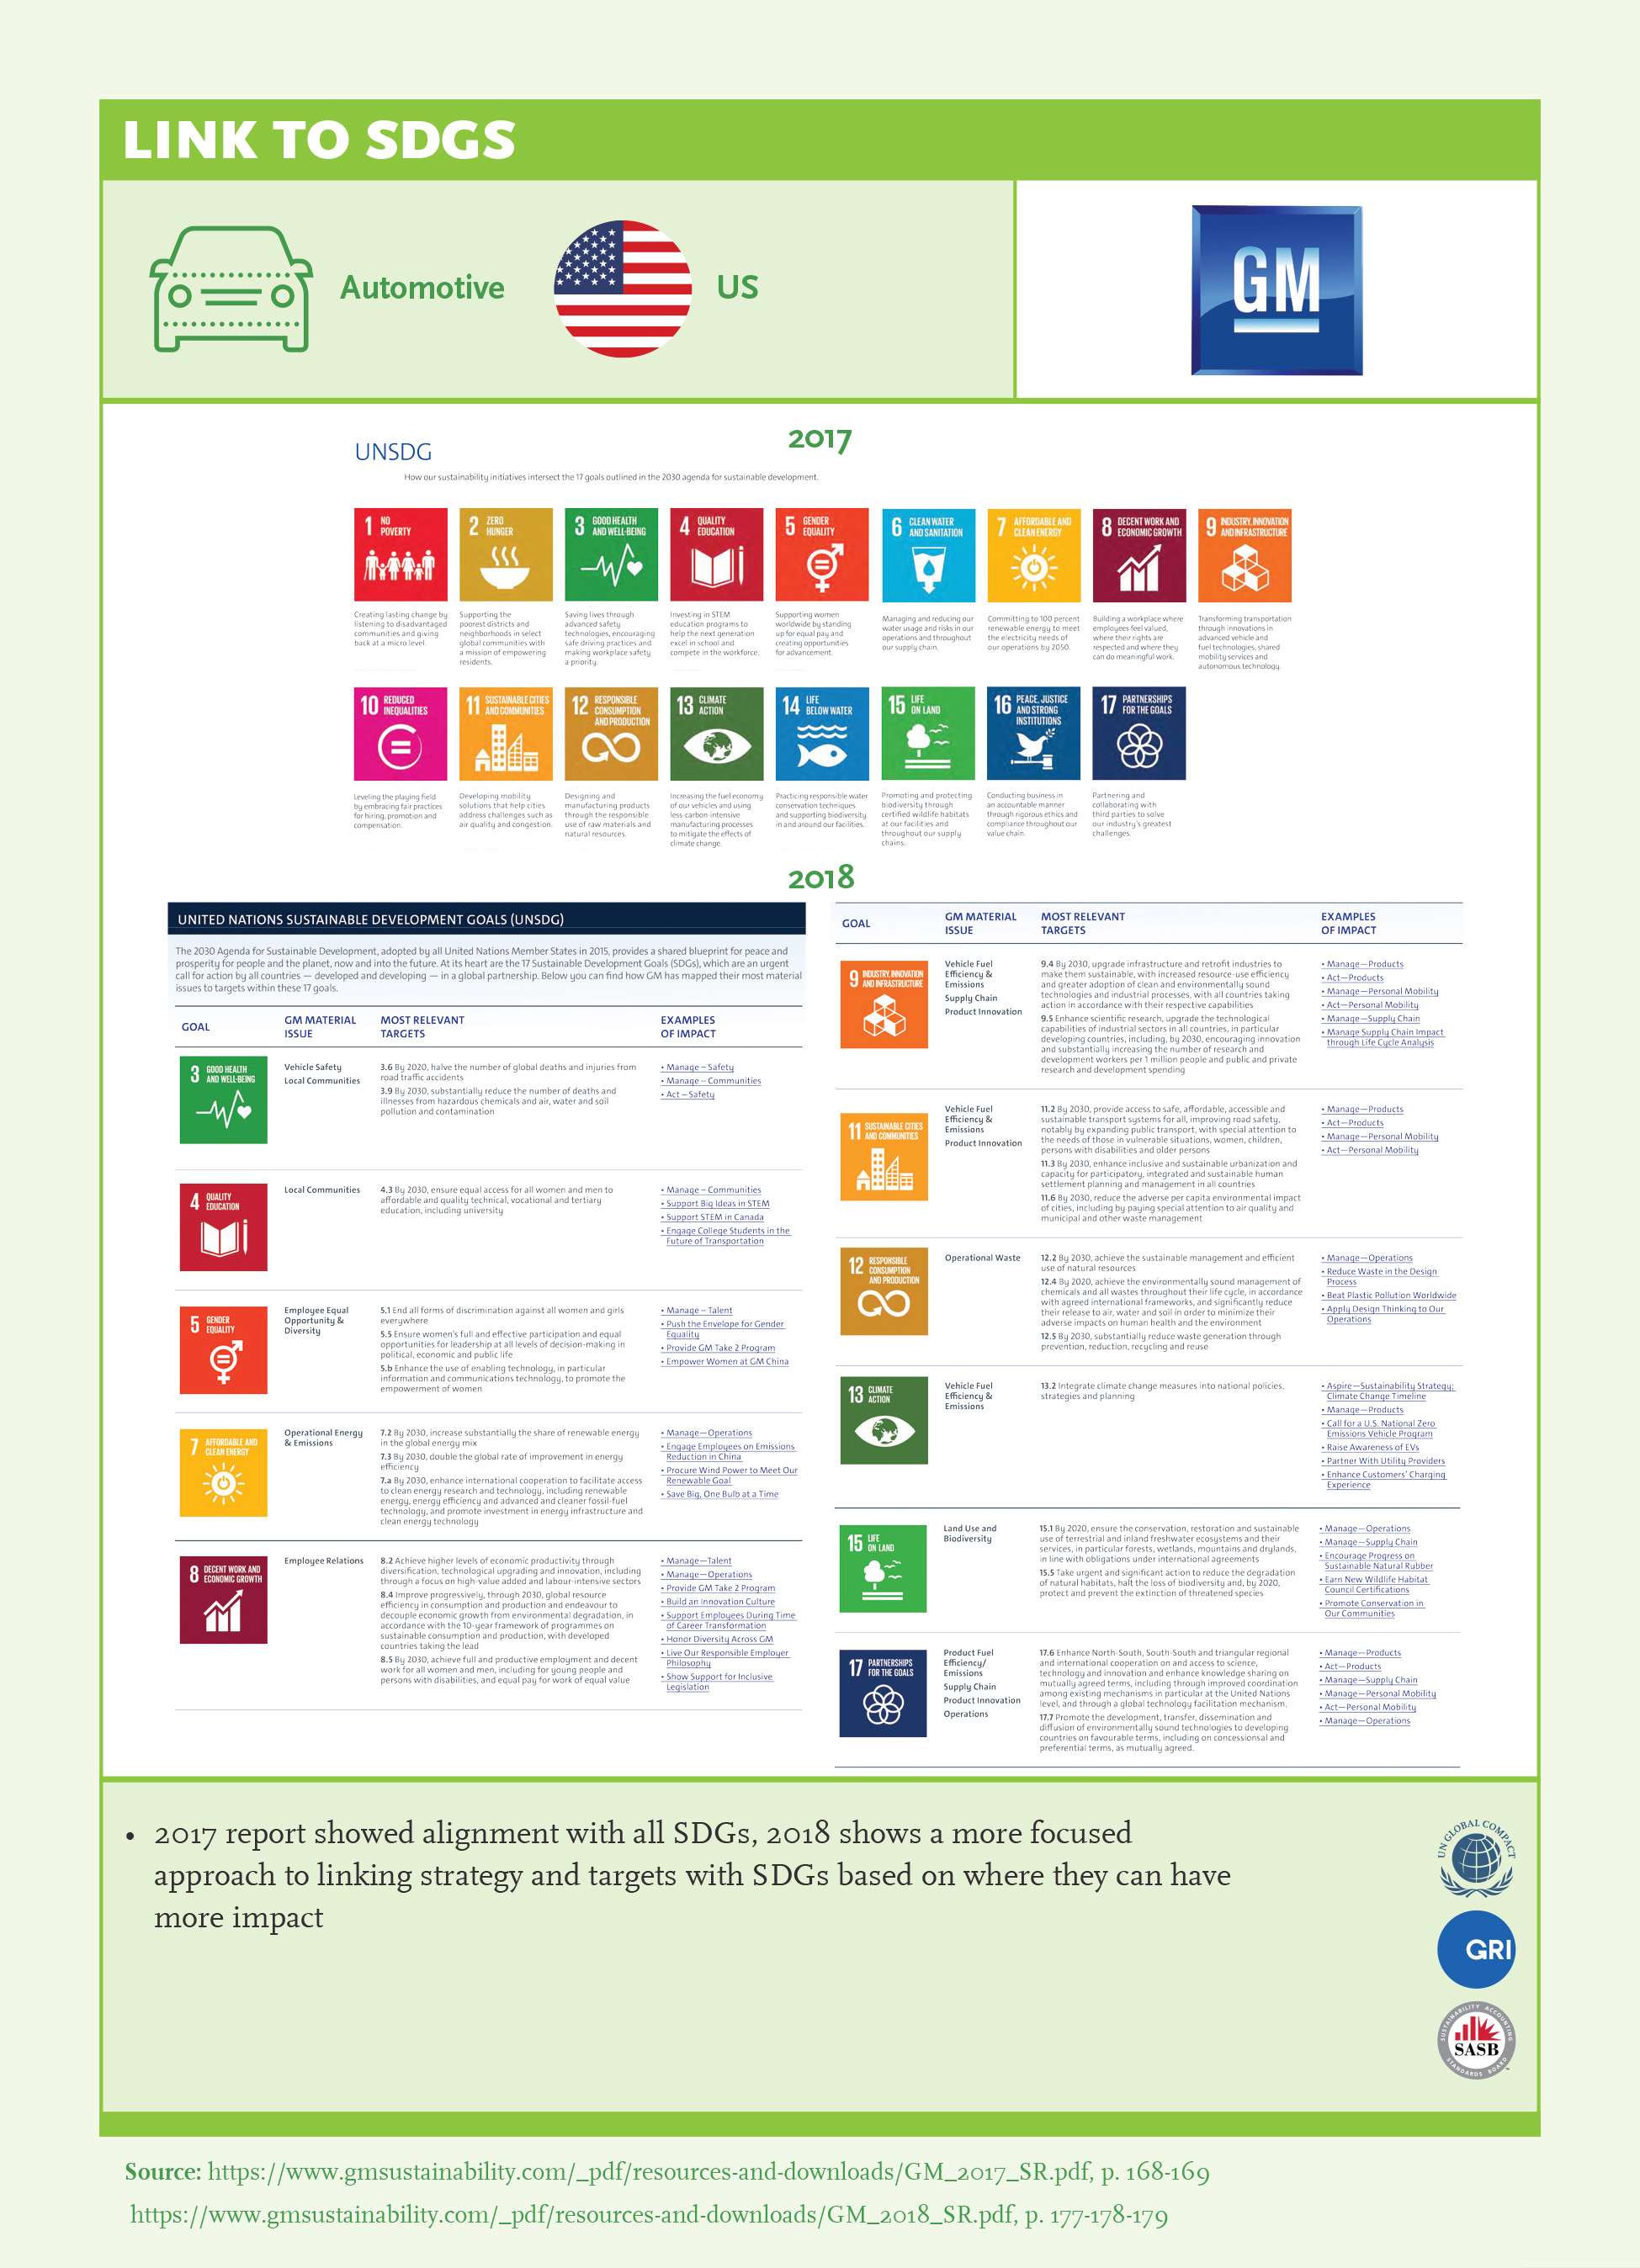
- 3Focus on a few that matters to drive impact: Link strategy and targets to relevant SDGs – based on your organization’s potential in maximizing positive impact and mitigating negative impact – this requires leadership to drive the SDG agenda – link to materiality. (Ex: General Motors)
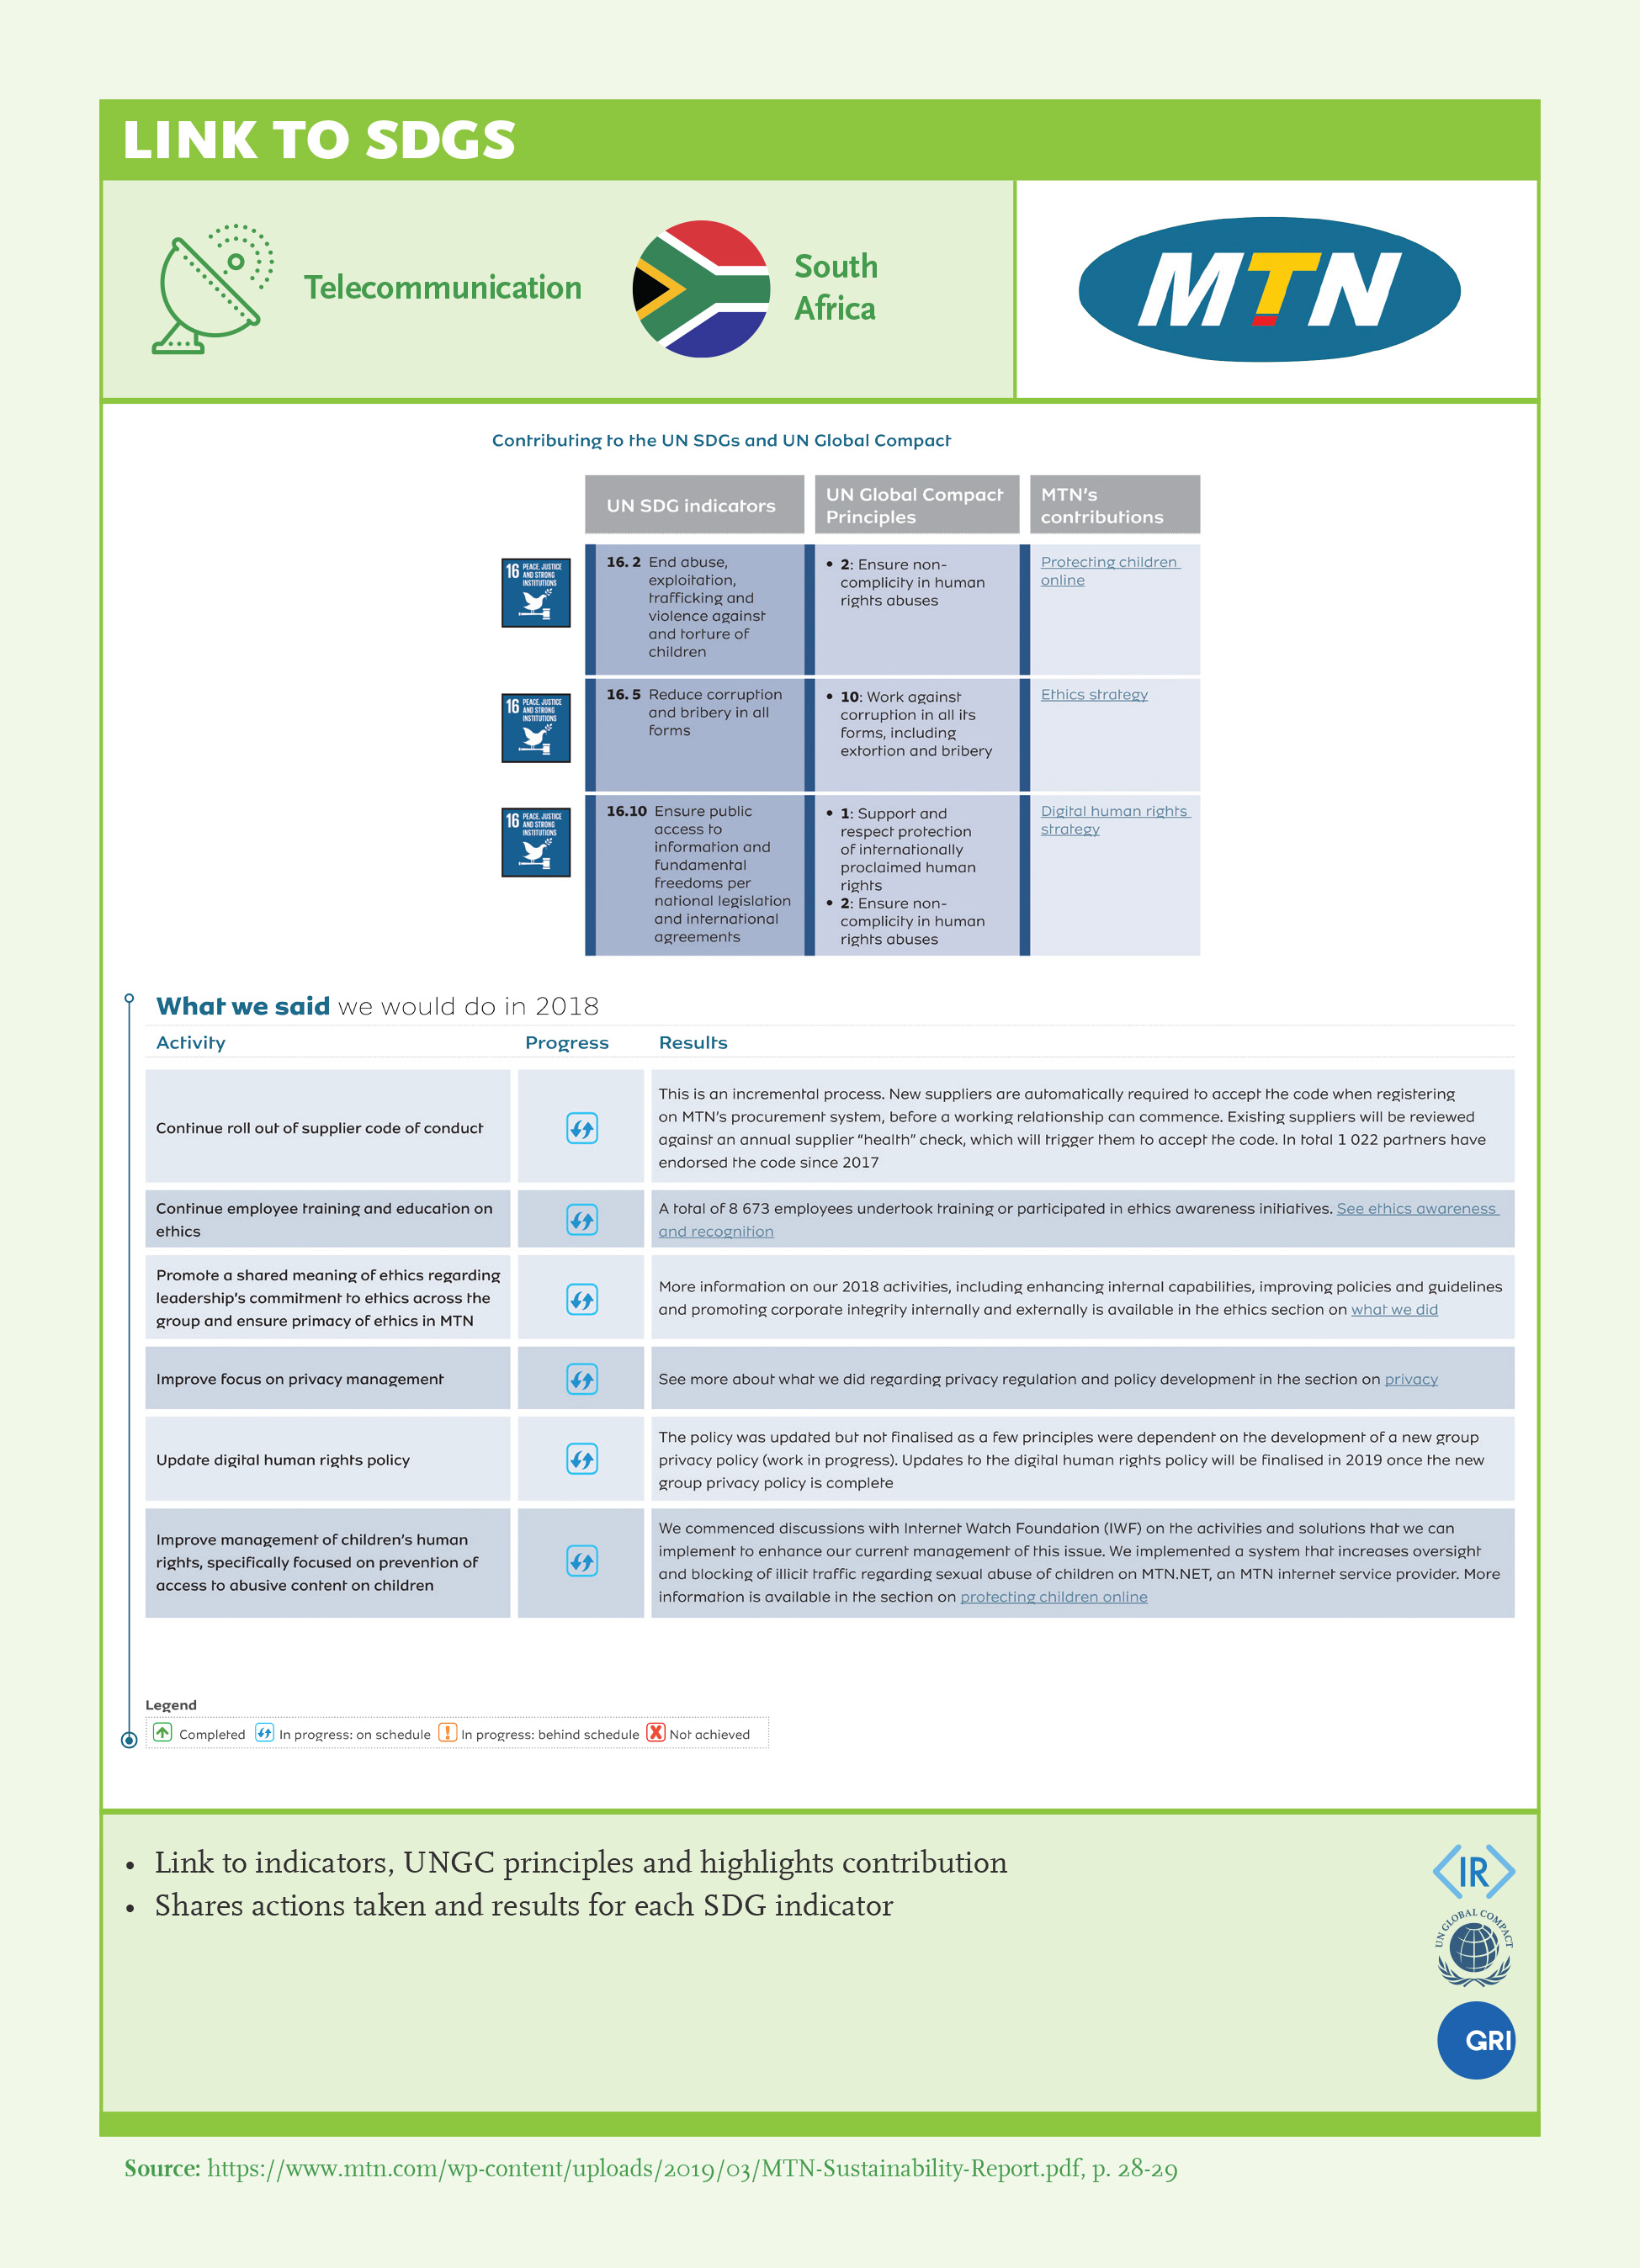
- 4Make it specific: Show link to sub-targets (preferably at target level). (Ex: MTN Group)
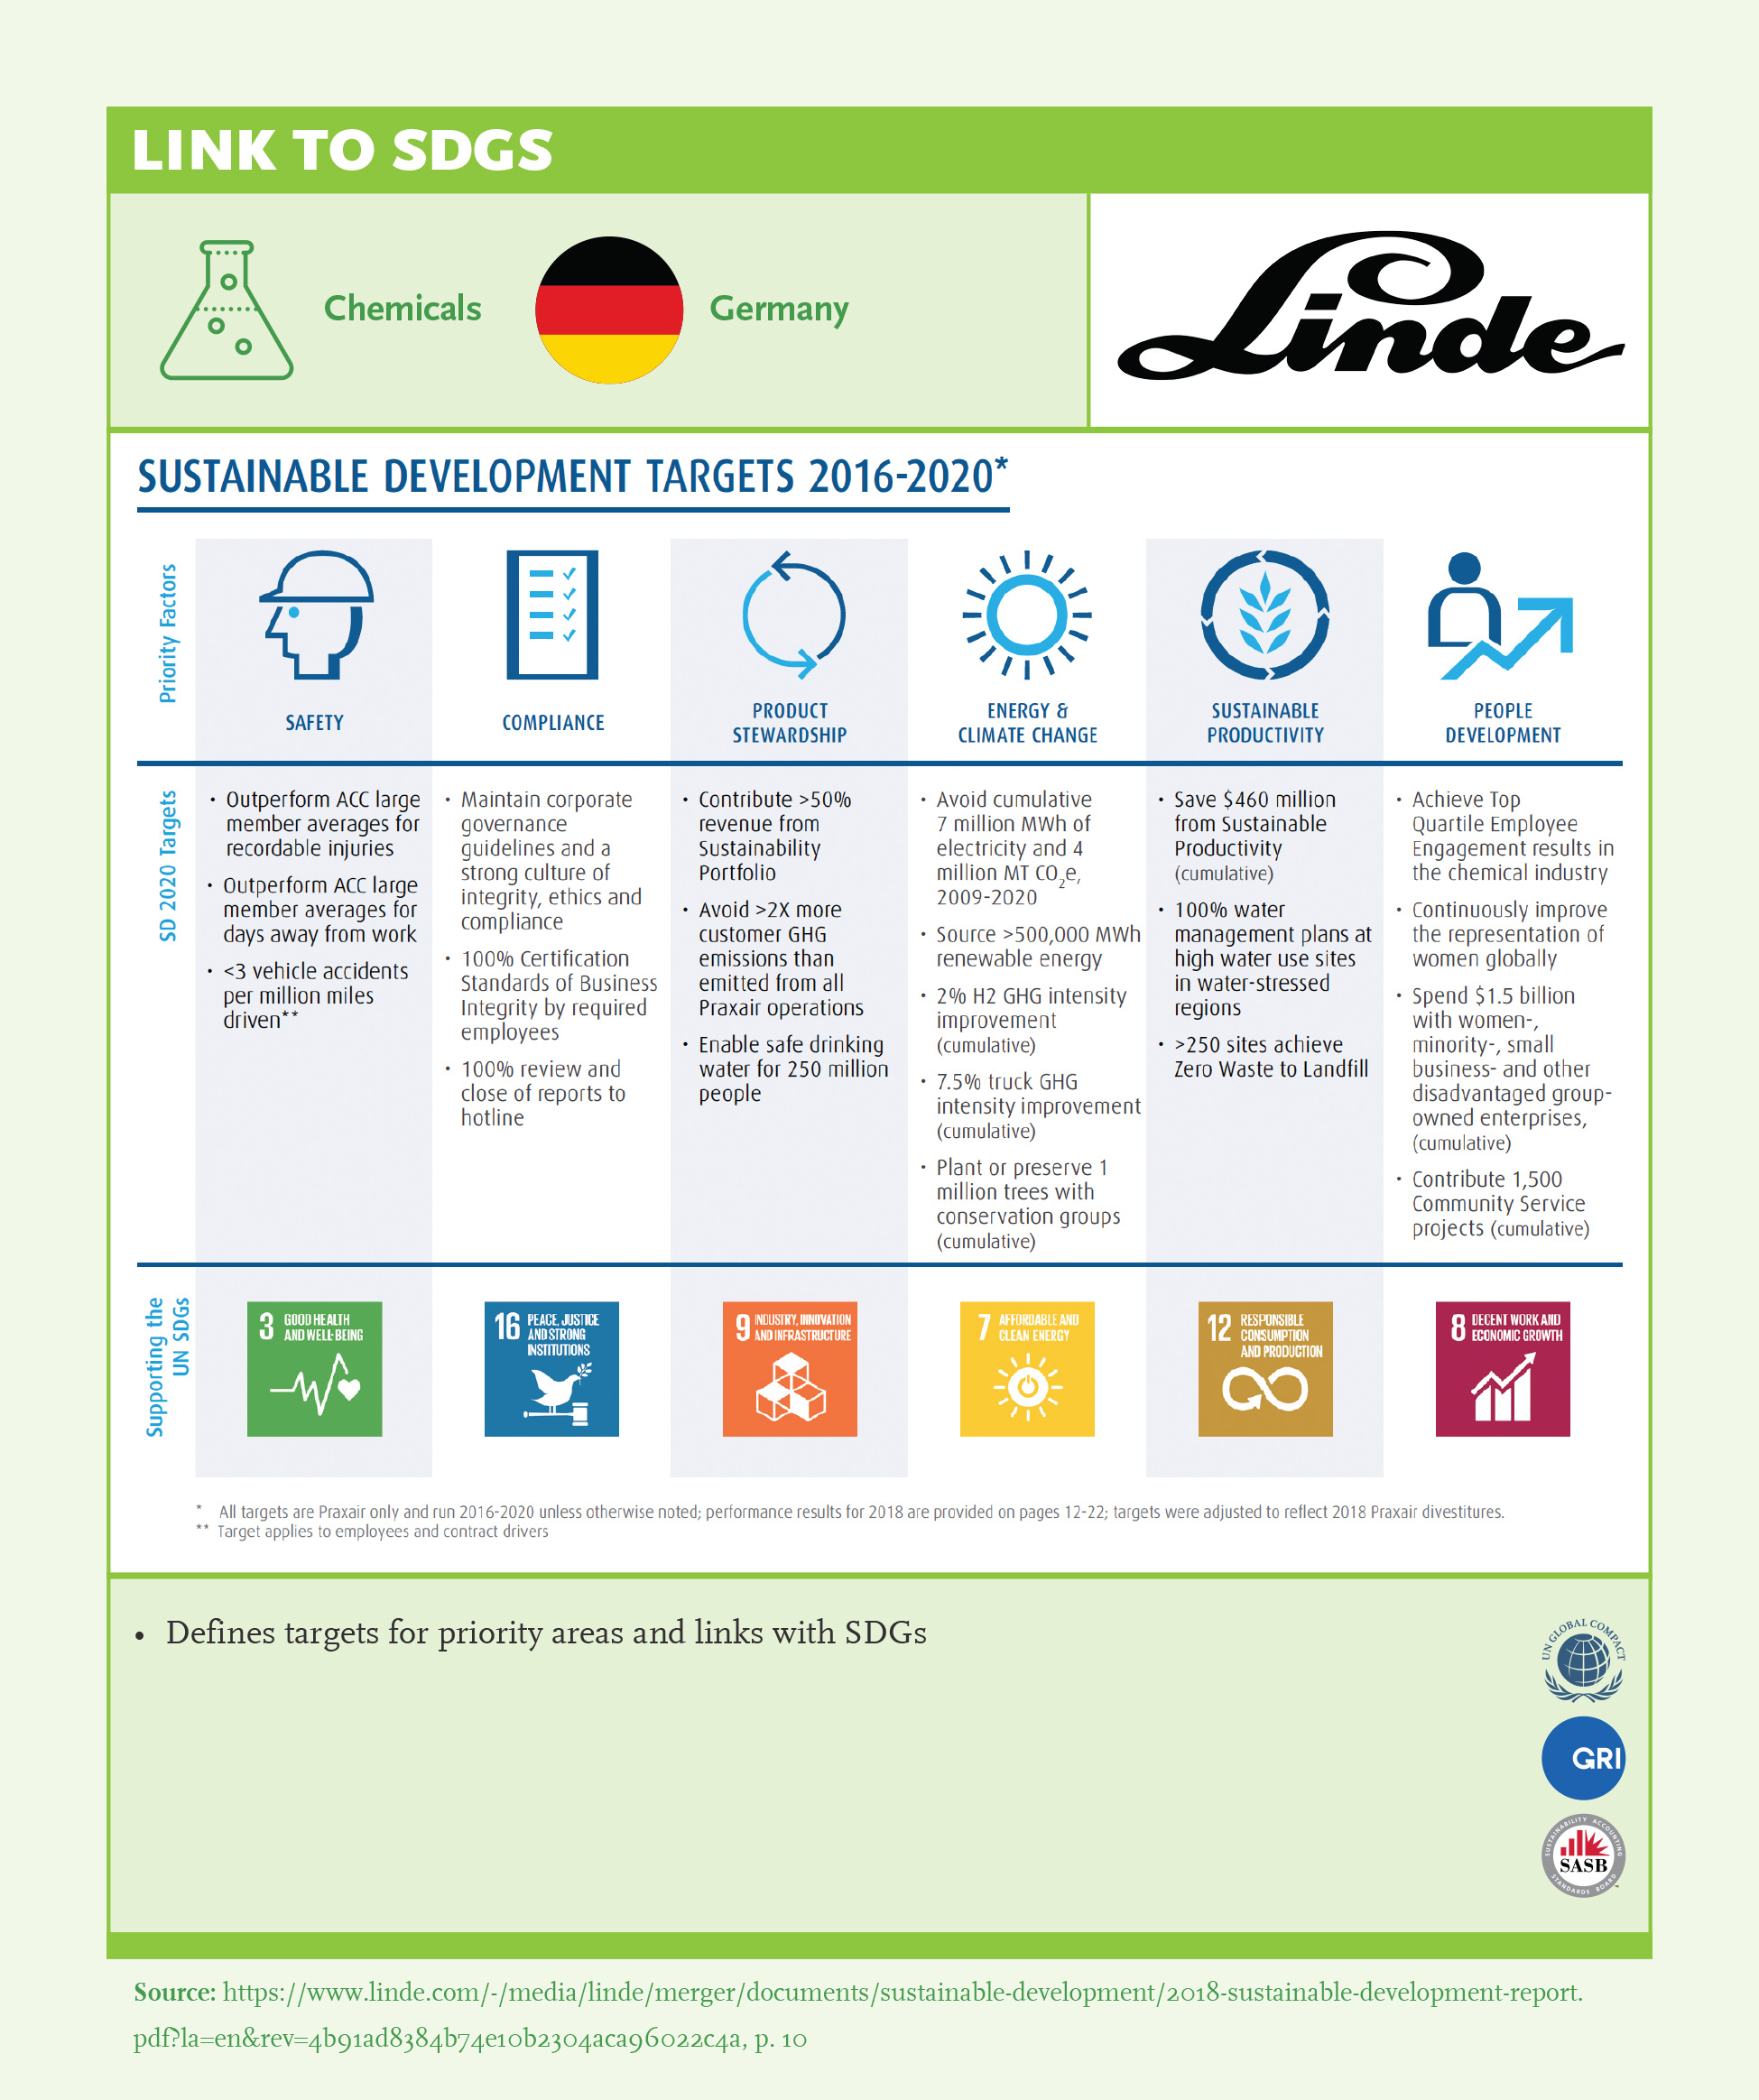
- 5Set targets and measure progress: Quantify your direct contribution – Set KPIs and SMART targets. Adopting a learning mindset, takes a mindset and systems change to shift – demonstrate evidence impact through activities and collaboration. (Ex: Linde)
- 6Develop and share an action plan to address gaps: SDGs are long-term targets for 2030 and addressing them successfully requires long-term thinking and a learning mindset. Companies that identify gaps to reach their targets and share action plans on how they will address them will be better positioned for continuous improvement in this journey. This would also signal to investors that the company is taking ownership of the issue.
- 7Think of your ecosystem: Impact significantly higher if you think of your value chain and have the power (Align with value chain impacts).
- 8Partner for impact both at the sector level and systemic level: Topics require partnerships for real impact and acceleration of progress, innovation and scale-up.
Key Findings

- There is a positive trend towards adopting SDGs compared to last year, but there is room for improvement, especially in results alignment: Link to SDGs increased 11% for strategy alignment (from 62% to 73%) and results alignment (48% to 59%).
- Among those that link its results to SDGs 38% prioritize 6-10 (21% of all companies) (44), 12% prioritize <5 goals (14), 59% >10 goals (59) – More focus is required to drive step-change in any particular SDG.
- Similar to last year, strategy and results alignment highest for SDG 8 (61%, 53%), SDG 13 (59%, 52%) and SDG 12 (57%, 48%) – focusing on areas relevant to core value proposition.
- Highest increase in strategy and results alignment is for SDG 3 – Good Health & Wellbeing (13%, 14%), SDG 5 – Gender Equality (12%,13%) and SDG 12 – Responsible Consumption and Production (12%, 13%).
- Strategy and results alignment is lowest for SDG 16 (29%, 24%) and SDG 14 (27%, 24%), SDG 2 (30%, 27%) and SDG 1 (32%, 28%).

- Strategy alignment and results linkage with SDGs is highest for Türkiye, South Africa, and UK (>80%), while lowest for India and China (<65%).
- Highest gap between strategy and results alignment with SDGs is in Türkiye and US (25%, 17%).

- Natural Resources (91%), Telco, Food Processors and Utilities (85%, 83%, 81%) companies have the highest strategy alignment with SDGs.
- Machinery & Equipment has the lowest strategy alignment and link to results with SDGs.
- Sectors that have the highest results link with SDGs are Chemicals (74%) and Natural Resources (72%), followed by Telco, Food Processors and Utilities.
- Highest gap between strategy alignment and results linkage is in Consumer Goods (23%) and Natural Resources (19%), lowest gap in Chemicals (4%), Automotive and Machinery & Equipment (7%).

- In each sector, companies on average link their strategy with 6-7 SDGs. Consumer Goods and Natural Resources companies link their strategy with 12-13 SDGs. Sectoral performance for SDG linkage is very low for Machinery & Equipment across the board (<30% across all SDGs). This signals that consumer-facing industries have been influenced by public sensitivity on working towards global goals and sustainability agenda, while B2B sectors such as M&E are slower to adopt global goals.
- SDG 8, 12 and 13 is adopted by >50% of companies in almost all sectors, only few are lagging behind. There is >50% adoption of specific SDGs in different sectors: Automotive (5, 7, 11), Chemicals: (3, 6, 7, 9), Retail: (3, 4, 10), Telco (3, 4, 5, 9), Utilities (5, 7, 9, 11). Pharma has the highest percentage in SDG 3, but there is no sector standard – all other SDGs are <50%.
- Less than 50% of GSL link their strategy with SDGs across all sectors, partnership is required to drive action on improving the climate. SDG 17 Partnership for Goals is adopted by >60% of Consumer Goods, Food and Natural Resources companies, sector and cross-sector partnerships are required to accelerate progress. For the SDGs listed, certain sectors take the lead in driving action on selected SDGs (>50% of companies in the sector has linked their strategy with the SDG): SDG 1 – Natural Resources, SDG 2 – Food Processors, SDG 11 – Automotive & Utilities, SDG 14 – Consumer Goods).